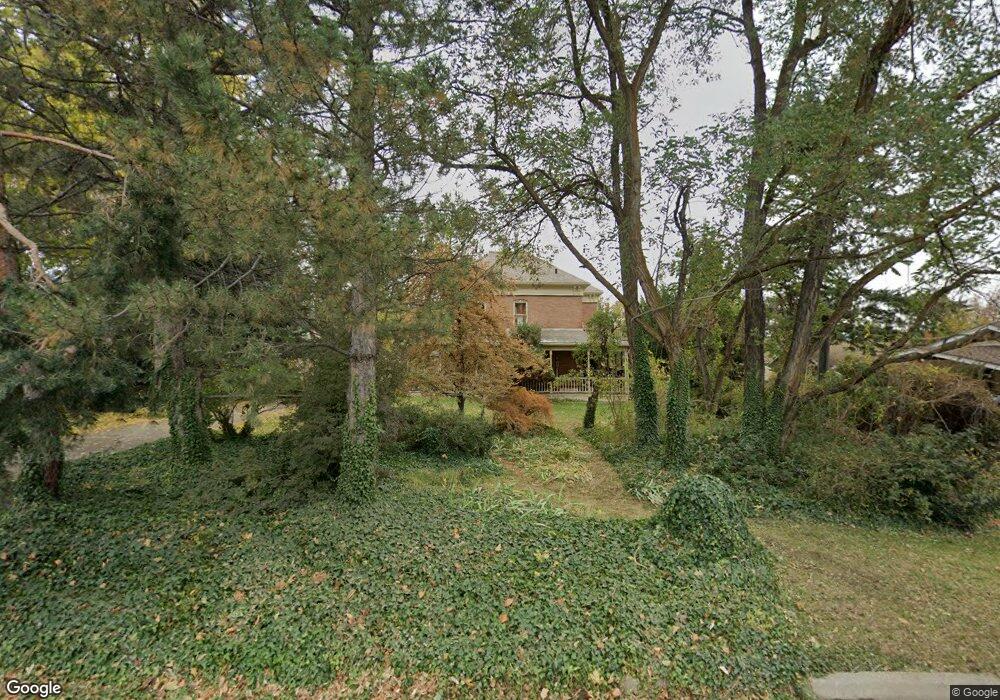
240 E 300 S Bountiful, UT 84010
Estimated Value: $491,000 - $579,000
4
Beds
2
Baths
2,544
Sq Ft
$210/Sq Ft
Est. Value
About This Home
This home is located at 240 E 300 S, Bountiful, UT 84010 and is currently estimated at $535,512, approximately $210 per square foot. 240 E 300 S is a home located in Davis County with nearby schools including Holbrook Elementary School, Millcreek Junior High School, and Bountiful High School.
Ownership History
Date
Name
Owned For
Owner Type
Purchase Details
Closed on
Nov 5, 2010
Sold by
Smith Sharon O
Bought by
Erickson Jason and Erickson Lindsay Mccall
Current Estimated Value
Home Financials for this Owner
Home Financials are based on the most recent Mortgage that was taken out on this home.
Original Mortgage
$178,101
Outstanding Balance
$117,826
Interest Rate
4.4%
Mortgage Type
FHA
Estimated Equity
$417,686
Purchase Details
Closed on
Mar 22, 2010
Sold by
Smith Sharon O and Ossmen Barbara
Bought by
Smith Sharon K
Create a Home Valuation Report for This Property
The Home Valuation Report is an in-depth analysis detailing your home's value as well as a comparison with similar homes in the area
Purchase History
| Date | Buyer | Sale Price | Title Company |
|---|---|---|---|
| Erickson Jason | -- | First American Title | |
| Smith Sharon K | -- | None Available |
Source: Public Records
Mortgage History
| Date | Status | Borrower | Loan Amount |
|---|---|---|---|
| Open | Erickson Jason | $178,101 |
Source: Public Records
Tax History
| Year | Tax Paid | Tax Assessment Tax Assessment Total Assessment is a certain percentage of the fair market value that is determined by local assessors to be the total taxable value of land and additions on the property. | Land | Improvement |
|---|---|---|---|---|
| 2025 | $2,891 | $259,050 | $138,736 | $120,314 |
| 2024 | $2,695 | $250,799 | $125,935 | $124,864 |
| 2023 | $2,598 | $241,450 | $126,436 | $115,013 |
| 2022 | $2,596 | $437,000 | $226,950 | $210,050 |
| 2021 | $2,384 | $338,000 | $163,433 | $174,567 |
| 2020 | $2,107 | $299,000 | $138,860 | $160,140 |
| 2019 | $2,160 | $300,000 | $141,657 | $158,343 |
| 2018 | $1,995 | $272,000 | $138,244 | $133,756 |
| 2016 | $1,682 | $123,860 | $59,029 | $64,831 |
| 2015 | $1,649 | $114,565 | $59,029 | $55,536 |
| 2014 | $1,604 | $114,685 | $59,029 | $55,656 |
| 2013 | -- | $104,497 | $43,945 | $60,552 |
Source: Public Records
Map
Nearby Homes
- 255 E 400 S
- 357 S 100 E
- 520 S Orchard Dr Unit 17
- 275 E Peach Ln S
- 456 E 500 S
- 545 S 100 E
- 323 Peach Ln
- 32 W 400 S
- 34 W 400 S
- 650 S Main St Unit 6206
- 650 S Main St Unit 4104
- 650 S Main St Unit 9106
- 698 E 200 S
- 55 E 200 N Unit 2
- 51 E 200 N Unit 3
- 49 E 200 N Unit 4
- 41 E 200 N Unit 6
- 254 N Main St
- 256 N Main St
- 252 N Main St
Your Personal Tour Guide
Ask me questions while you tour the home.