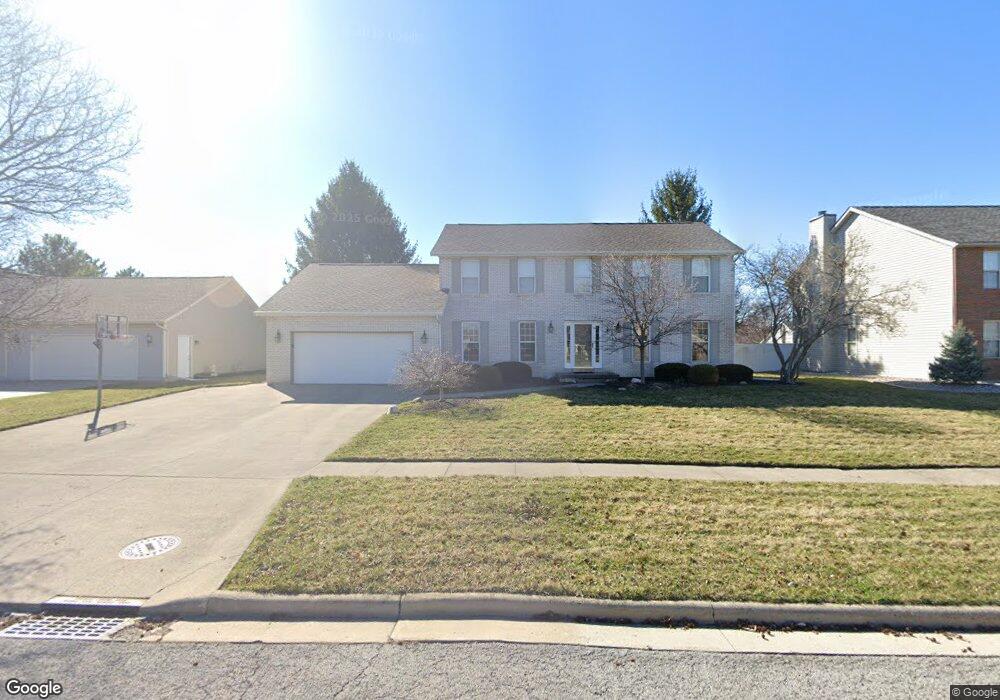
240 E Sawmill Rd Findlay, OH 45840
Estimated Value: $323,000 - $380,170
4
Beds
3
Baths
2,520
Sq Ft
$142/Sq Ft
Est. Value
About This Home
This home is located at 240 E Sawmill Rd, Findlay, OH 45840 and is currently estimated at $357,793, approximately $141 per square foot. 240 E Sawmill Rd is a home located in Hancock County with nearby schools including Wilson Vance Elementary School, Whittier Elementary School, and Donnell Middle School.
Ownership History
Date
Name
Owned For
Owner Type
Purchase Details
Closed on
Jan 31, 2005
Sold by
Best Roger
Bought by
Nelson Stephen A and Nelson Beth A
Current Estimated Value
Home Financials for this Owner
Home Financials are based on the most recent Mortgage that was taken out on this home.
Original Mortgage
$115,000
Interest Rate
5.21%
Mortgage Type
Purchase Money Mortgage
Purchase Details
Closed on
Aug 1, 1995
Sold by
Best Roger
Bought by
Ludwig Robert and Ludwig Kristin
Home Financials for this Owner
Home Financials are based on the most recent Mortgage that was taken out on this home.
Original Mortgage
$104,000
Interest Rate
7.59%
Mortgage Type
New Conventional
Purchase Details
Closed on
Apr 28, 1993
Bought by
Best Roger
Create a Home Valuation Report for This Property
The Home Valuation Report is an in-depth analysis detailing your home's value as well as a comparison with similar homes in the area
Home Values in the Area
Average Home Value in this Area
Purchase History
| Date | Buyer | Sale Price | Title Company |
|---|---|---|---|
| Nelson Stephen A | $195,000 | Golden Key Title Agency | |
| Ludwig Robert | $130,000 | -- | |
| Best Roger | -- | -- |
Source: Public Records
Mortgage History
| Date | Status | Borrower | Loan Amount |
|---|---|---|---|
| Previous Owner | Nelson Stephen A | $115,000 | |
| Previous Owner | Ludwig Robert | $104,000 |
Source: Public Records
Tax History
| Year | Tax Paid | Tax Assessment Tax Assessment Total Assessment is a certain percentage of the fair market value that is determined by local assessors to be the total taxable value of land and additions on the property. | Land | Improvement |
|---|---|---|---|---|
| 2024 | $3,660 | $103,030 | $10,770 | $92,260 |
| 2023 | $3,666 | $103,030 | $10,770 | $92,260 |
| 2022 | $3,653 | $103,030 | $10,770 | $92,260 |
| 2021 | $3,561 | $87,490 | $10,380 | $77,110 |
| 2020 | $3,561 | $87,490 | $10,380 | $77,110 |
| 2019 | $3,489 | $87,490 | $10,380 | $77,110 |
| 2018 | $3,203 | $73,690 | $9,430 | $64,260 |
| 2017 | $3,204 | $73,690 | $9,430 | $64,260 |
| 2016 | $3,150 | $73,690 | $9,430 | $64,260 |
| 2015 | $3,120 | $71,360 | $10,030 | $61,330 |
| 2014 | $3,121 | $71,360 | $10,030 | $61,330 |
| 2012 | $3,290 | $74,740 | $10,030 | $64,710 |
Source: Public Records
Map
Nearby Homes
- 1421 E Sandusky St
- 309 Huron Rd
- 1001 Decker Ave
- 1421 Autumn Dr
- 1020 Country Club Dr
- 15591 Canadian Way
- 15586 Canadian Way
- 15615 Canadian Way
- 1200 1st St
- 1308 Greendale Ave
- 1037 Fishlock Ave
- 1521 Middle Ct
- 439 Carnahan Ave
- 640 Center St
- 707 Winterhaven Dr
- 1825 Greendale Ave
- 523 Center St
- 1125 Glen Meadow Dr
- 401 Westchester Dr
- 1209 Heather Dr
- 300 E Sawmill Rd
- 225 W Sawmill Rd
- 217 W Sawmill Rd
- 301 W Sawmill Rd
- 308 E Sawmill Rd
- 233 E Sawmill Rd
- 1425 Sawmill Cove
- 209 W Sawmill Rd
- 309 W Sawmill Rd
- 216 E Sawmill Rd
- 316 E Sawmill Rd
- 225 E Sawmill Rd
- 0 W Sawmill Rd
- 309 E Sawmill Rd
- 201 W Sawmill Rd
- 317 W Sawmill Rd
- 217 E Sawmill Rd
- 208 E Sawmill Rd
- 317 E Sawmill Rd
- 224 W Sawmill Rd
Your Personal Tour Guide
Ask me questions while you tour the home.