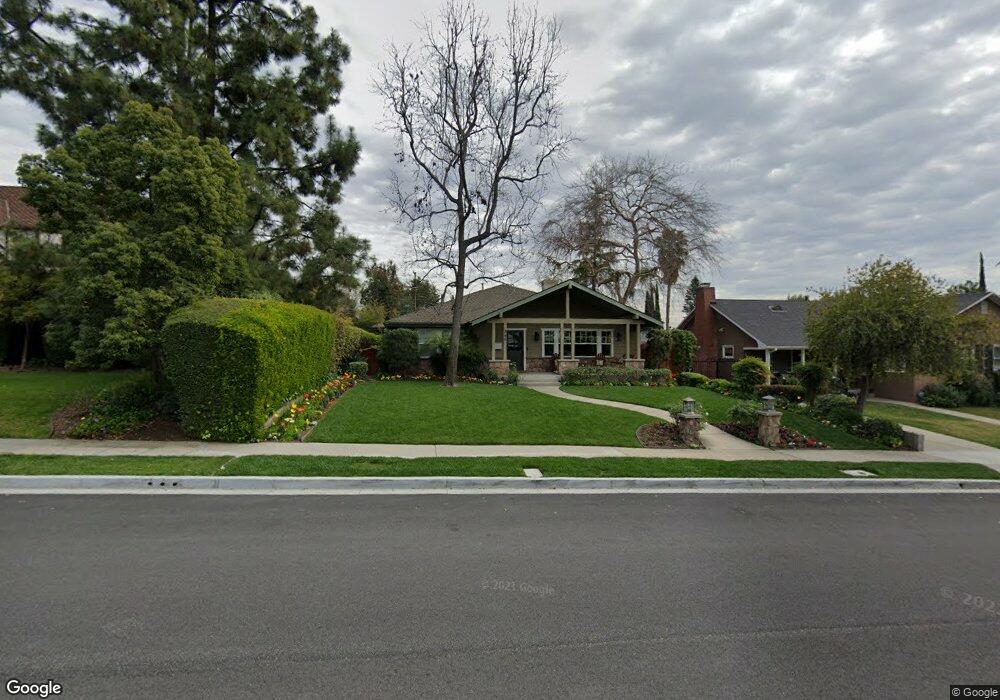
240 Highland Place Monrovia, CA 91016
Estimated Value: $2,187,015 - $2,420,000
5
Beds
3
Baths
3,064
Sq Ft
$739/Sq Ft
Est. Value
About This Home
This home is located at 240 Highland Place, Monrovia, CA 91016 and is currently estimated at $2,263,504, approximately $738 per square foot. 240 Highland Place is a home located in Los Angeles County with nearby schools including Mayflower Elementary School, Clifton Middle School, and Monrovia High School.
Ownership History
Date
Name
Owned For
Owner Type
Purchase Details
Closed on
May 6, 2022
Sold by
Kelley And David Johnson Family Trust
Bought by
David L Tatge 2009 Dynasty Trust
Current Estimated Value
Purchase Details
Closed on
Jan 8, 2020
Sold by
Johnson David Charles and Johnson Kelly Ann
Bought by
Johnson David Charles and Johnson Kelly Ann
Purchase Details
Closed on
Feb 21, 2002
Sold by
Roy Gar Enterprises Inc
Bought by
Johnson David Charles
Home Financials for this Owner
Home Financials are based on the most recent Mortgage that was taken out on this home.
Original Mortgage
$577,300
Interest Rate
5.62%
Purchase Details
Closed on
Aug 7, 2001
Sold by
Gaughan John W
Bought by
Roy Gar Enterprises Inc
Home Financials for this Owner
Home Financials are based on the most recent Mortgage that was taken out on this home.
Original Mortgage
$220,000
Interest Rate
6.9%
Create a Home Valuation Report for This Property
The Home Valuation Report is an in-depth analysis detailing your home's value as well as a comparison with similar homes in the area
Home Values in the Area
Average Home Value in this Area
Purchase History
| Date | Buyer | Sale Price | Title Company |
|---|---|---|---|
| David L Tatge 2009 Dynasty Trust | $2,200,000 | Lawyers Title | |
| Johnson David Charles | -- | None Available | |
| Johnson David Charles | $708,000 | Orange Coast Title | |
| Roy Gar Enterprises Inc | $305,000 | -- |
Source: Public Records
Mortgage History
| Date | Status | Borrower | Loan Amount |
|---|---|---|---|
| Previous Owner | Johnson David Charles | $577,300 | |
| Previous Owner | Roy Gar Enterprises Inc | $220,000 | |
| Closed | Johnson David Charles | $72,162 |
Source: Public Records
Tax History Compared to Growth
Tax History
| Year | Tax Paid | Tax Assessment Tax Assessment Total Assessment is a certain percentage of the fair market value that is determined by local assessors to be the total taxable value of land and additions on the property. | Land | Improvement |
|---|---|---|---|---|
| 2025 | $30,120 | $2,334,657 | $1,400,794 | $933,863 |
| 2024 | $30,120 | $2,288,880 | $1,373,328 | $915,552 |
| 2023 | $29,418 | $2,244,000 | $1,346,400 | $897,600 |
| 2022 | $13,435 | $1,003,395 | $440,550 | $562,845 |
| 2021 | $18,777 | $983,721 | $431,912 | $551,809 |
| 2019 | $18,098 | $954,545 | $419,102 | $535,443 |
| 2018 | $17,749 | $935,830 | $410,885 | $524,945 |
| 2016 | $17,248 | $899,492 | $394,931 | $504,561 |
| 2015 | $17,001 | $885,982 | $388,999 | $496,983 |
| 2014 | $11,328 | $868,628 | $381,380 | $487,248 |
Source: Public Records
Map
Nearby Homes
- 208 Highland Place
- 803 Crescent Dr
- 171 N Sunset Place
- 550 W Foothill Blvd Unit C
- 846 W Hillcrest Blvd
- 891 Crescent Dr
- 453 N Alta Vista Ave
- 334 Linwood Ave
- 220 W Hillcrest Blvd
- 221 Violet Ave Unit A
- 214 Fowler Dr
- 836 W Foothill Blvd Unit A
- 267 Linwood Ave Unit E
- 325 N Madison Ave
- 537 Cloverleaf Dr
- 330 N Madison Ave
- 239 W Palm Ave
- 324 Fowler Dr
- 318 N Terrace View Dr
- 1209 Valencia Way
- 236 Highland Place
- 248 Highland Place
- 230 Highland Place
- 522 W Hillcrest Blvd
- 239 N Mayflower Ave Unit 2
- 239 N Mayflower Ave
- 243 N Mayflower Ave
- 235 N Mayflower Ave
- 247 N Mayflower Ave
- 231 N Mayflower Ave
- 243 Highland Place
- 255 N Mayflower Ave
- 255 N Mayflower Ave
- 237 Highland Place
- 225 N Mayflower Ave Unit A
- 225 N Mayflower Ave
- 225 Highland Place
- 221 N Mayflower Ave
- 229 N Mayflower Ave
- 227 N Mayflower Ave