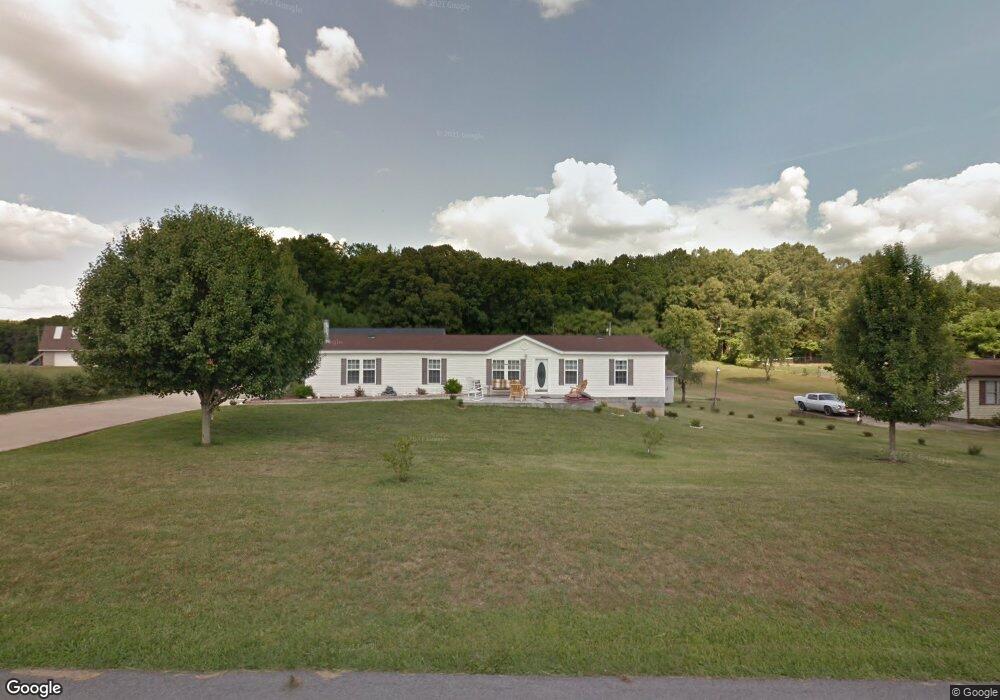
240 Hunt Rd Jonesborough, TN 37659
Estimated Value: $204,000 - $362,000
3
Beds
2
Baths
1,792
Sq Ft
$151/Sq Ft
Est. Value
About This Home
This home is located at 240 Hunt Rd, Jonesborough, TN 37659 and is currently estimated at $270,000, approximately $150 per square foot. 240 Hunt Rd is a home located in Washington County with nearby schools including Gray Elementary School and Daniel Boone High School.
Ownership History
Date
Name
Owned For
Owner Type
Purchase Details
Closed on
Jan 20, 2021
Sold by
Quillen Michael Thomas
Bought by
Neighbor Pamela R
Current Estimated Value
Purchase Details
Closed on
Oct 26, 2015
Sold by
Neighbor Pamela R
Bought by
Quillen Michael Thomas
Purchase Details
Closed on
Oct 12, 2006
Sold by
Carberry Gary A
Bought by
Neighbor Dennis K
Home Financials for this Owner
Home Financials are based on the most recent Mortgage that was taken out on this home.
Original Mortgage
$72,500
Interest Rate
6.39%
Purchase Details
Closed on
Feb 7, 2002
Sold by
Gilliam Thomas R
Bought by
Carberry Gary A
Home Financials for this Owner
Home Financials are based on the most recent Mortgage that was taken out on this home.
Original Mortgage
$15,800
Interest Rate
7.12%
Purchase Details
Closed on
Oct 4, 1991
Bought by
Gilliam Thomas R and Gilliam Gladys M
Purchase Details
Closed on
Apr 15, 1987
Create a Home Valuation Report for This Property
The Home Valuation Report is an in-depth analysis detailing your home's value as well as a comparison with similar homes in the area
Home Values in the Area
Average Home Value in this Area
Purchase History
| Date | Buyer | Sale Price | Title Company |
|---|---|---|---|
| Neighbor Pamela R | -- | Classic Title Ins Co Inc | |
| Quillen Michael Thomas | -- | -- | |
| Neighbor Dennis K | $97,500 | -- | |
| Carberry Gary A | $17,500 | -- | |
| Gilliam Thomas R | $48,000 | -- | |
| -- | $4,800 | -- |
Source: Public Records
Mortgage History
| Date | Status | Borrower | Loan Amount |
|---|---|---|---|
| Previous Owner | -- | $72,500 | |
| Previous Owner | -- | $15,800 |
Source: Public Records
Tax History Compared to Growth
Tax History
| Year | Tax Paid | Tax Assessment Tax Assessment Total Assessment is a certain percentage of the fair market value that is determined by local assessors to be the total taxable value of land and additions on the property. | Land | Improvement |
|---|---|---|---|---|
| 2024 | $1,023 | $59,825 | $4,250 | $55,575 |
| 2023 | $653 | $30,350 | $0 | $0 |
| 2022 | $653 | $30,350 | $3,750 | $26,600 |
| 2021 | $653 | $30,350 | $3,750 | $26,600 |
| 2020 | $653 | $30,350 | $3,750 | $26,600 |
| 2019 | $569 | $30,350 | $3,750 | $26,600 |
| 2018 | $569 | $23,900 | $3,750 | $20,150 |
| 2017 | $569 | $23,900 | $3,750 | $20,150 |
| 2016 | $569 | $23,900 | $3,750 | $20,150 |
| 2015 | $473 | $23,900 | $3,750 | $20,150 |
| 2014 | $473 | $23,900 | $3,750 | $20,150 |
Source: Public Records
Map
Nearby Homes
- 00 Rd
- Tbd Tranquil Ct
- Lot 19 Steepleview Ct
- Lot 14 Steepleview Ct
- Lot 15 Steepleview Ct
- 140 Hulse Rd
- 110 Rhetts Way
- Lot 9 Larkins Farm Dr
- Lot 13 Larkins Farm Dr
- Lot 10 Larkins Farm Dr
- 1238 Fordtown Rd
- 545 Fordtown Rd
- 120 Wheelock Rd
- TBD Harmony Rd
- 480 Fordtown Rd
- 689 Painter Rd
- 665 Painter Rd
- 0 A Deakins Rd
- 3324 Cottage Green Ct
- 3149 Phillips Way
- 236 Hunt Rd
- 230 Hunt Rd
- 242 Hunt Rd
- 0 Hunt Rd
- LOT # 2 Hunt Rd
- LOT # Hunt Rd
- 136 Harmony Farms Dr
- 258 Hunt Rd
- 218 Hunt Rd
- 262 Hunt Rd
- 135 Harmony Farms Dr
- 168 Harmony Farms Dr
- 168 Harmony Farms Dr
- Tbd Harmony Farms Dr
- 172 Harmony Farms Dr
- 151 Harmony Farms Dr
- 280 Hunt Rd
- 174 Harmony Farms Dr
- 169 Harmony Farms Dr
- 0 Tranquil Ct