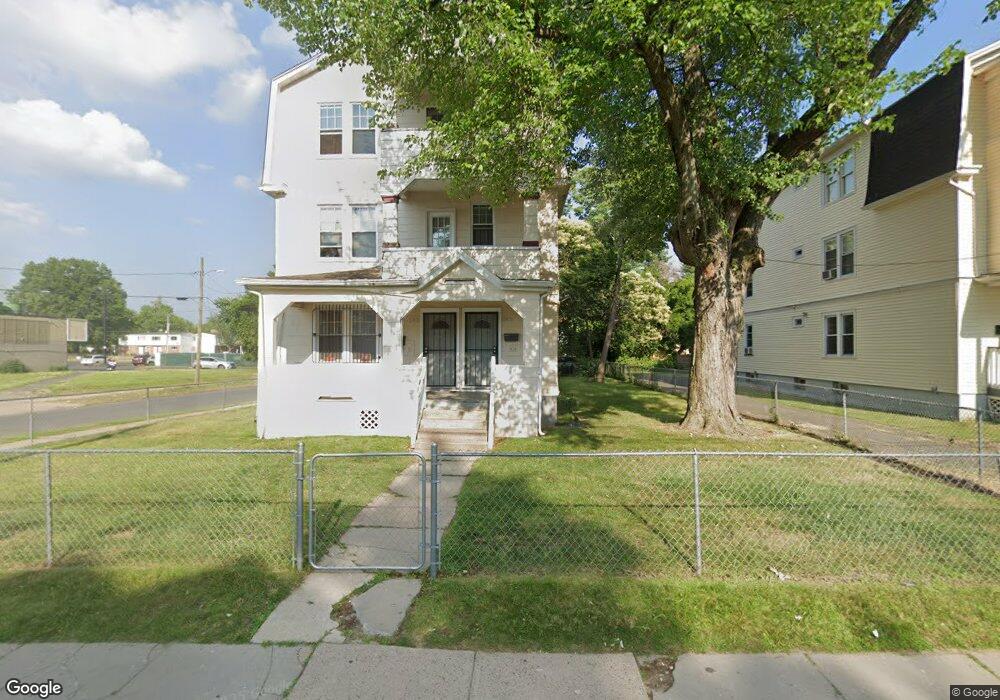
240 Martin St Unit 242 Hartford, CT 06120
North End NeighborhoodEstimated Value: $355,927 - $369,000
6
Beds
3
Baths
3,666
Sq Ft
$98/Sq Ft
Est. Value
About This Home
This home is located at 240 Martin St Unit 242, Hartford, CT 06120 and is currently estimated at $360,982, approximately $98 per square foot. 240 Martin St Unit 242 is a home located in Hartford County with nearby schools including Capital Preparatory Magnet School, Perry Elementary School, and Ib Global Communications Academy.
Ownership History
Date
Name
Owned For
Owner Type
Purchase Details
Closed on
Aug 29, 2025
Sold by
Phiama T T and Phiama Tindal
Bought by
Abundant Prop & Invs Llc
Current Estimated Value
Home Financials for this Owner
Home Financials are based on the most recent Mortgage that was taken out on this home.
Original Mortgage
$390,000
Outstanding Balance
$389,327
Interest Rate
6.75%
Mortgage Type
Commercial
Estimated Equity
-$28,345
Purchase Details
Closed on
May 28, 2025
Sold by
Tindal Kiesha
Bought by
Phiama T
Purchase Details
Closed on
Jun 29, 2006
Sold by
Andrens Daniel J
Bought by
Tindal Kiesha J
Home Financials for this Owner
Home Financials are based on the most recent Mortgage that was taken out on this home.
Original Mortgage
$216,600
Interest Rate
6.58%
Mortgage Type
Purchase Money Mortgage
Create a Home Valuation Report for This Property
The Home Valuation Report is an in-depth analysis detailing your home's value as well as a comparison with similar homes in the area
Home Values in the Area
Average Home Value in this Area
Purchase History
| Date | Buyer | Sale Price | Title Company |
|---|---|---|---|
| Abundant Prop & Invs Llc | $370,000 | -- | |
| Phiama T | -- | None Available | |
| Phiama T | -- | None Available | |
| Tindal Kiesha J | $220,000 | -- | |
| Tindal Kiesha J | $220,000 | -- |
Source: Public Records
Mortgage History
| Date | Status | Borrower | Loan Amount |
|---|---|---|---|
| Open | Abundant Prop & Invs Llc | $390,000 | |
| Previous Owner | Tindal Kiesha J | $23,995 | |
| Previous Owner | Tindal Kiesha J | $196,363 | |
| Previous Owner | Tindal Kiesha J | $216,600 | |
| Previous Owner | Tindal Kiesha J | $6,600 |
Source: Public Records
Tax History Compared to Growth
Tax History
| Year | Tax Paid | Tax Assessment Tax Assessment Total Assessment is a certain percentage of the fair market value that is determined by local assessors to be the total taxable value of land and additions on the property. | Land | Improvement |
|---|---|---|---|---|
| 2025 | $5,532 | $80,225 | $4,079 | $76,146 |
| 2024 | $5,532 | $80,225 | $4,079 | $76,146 |
| 2023 | $5,532 | $80,225 | $4,079 | $76,146 |
| 2022 | $3,731 | $80,225 | $4,079 | $76,146 |
| 2021 | $3,731 | $50,225 | $3,640 | $46,585 |
| 2020 | $3,731 | $50,225 | $3,640 | $46,585 |
| 2019 | $3,731 | $50,225 | $3,640 | $46,585 |
| 2018 | $3,605 | $48,532 | $3,518 | $45,014 |
| 2016 | $2,986 | $40,198 | $3,350 | $36,848 |
| 2015 | $2,844 | $38,289 | $3,191 | $35,098 |
| 2014 | $2,775 | $37,353 | $3,113 | $34,240 |
Source: Public Records
Map
Nearby Homes
- 158 Martin St Unit 160
- 25 Judson St Unit C
- 142 Clark St
- 275 Westland St
- 238 Enfield St Unit 240
- 37 Martin St
- 2657 Main St Unit 2659
- 551 Garden St Unit 553
- 147 Enfield St Unit 149
- 75 Cleveland Ave
- 50 Mansfield St
- 39 Capen St
- 35 Loomis St
- 59 Mansfield St Unit 61
- 87 Mansfield St Unit 89
- 33 Warren St
- 270 Bellevue St
- 33 E Raymond St Unit 35
- 68 Enfield St Unit 70
- 67 Enfield St Unit 37
- 240 Martin St Unit 1st Floor
- 240 Martin St Unit 2
- 234 Martin St Unit 236
- 239 Martin St Unit 241
- 233 Martin St Unit 235
- 251 Martin St Unit 253
- 229 Martin St Unit 231
- 251 253 Martin St Unit 3 FL
- 251 253 Martin St
- 259 Barbour St
- 255 Martin St Unit 257
- 226 Martin St Unit 2
- 226 Martin St
- 226 Martin St Unit 4
- 226 Martin St Unit 1
- 226 Martin St Unit 7
- 220 Martin St
- 223 Martin St Unit 225
- 40 Risley St Unit 42
- 40 Risley St Unit 1