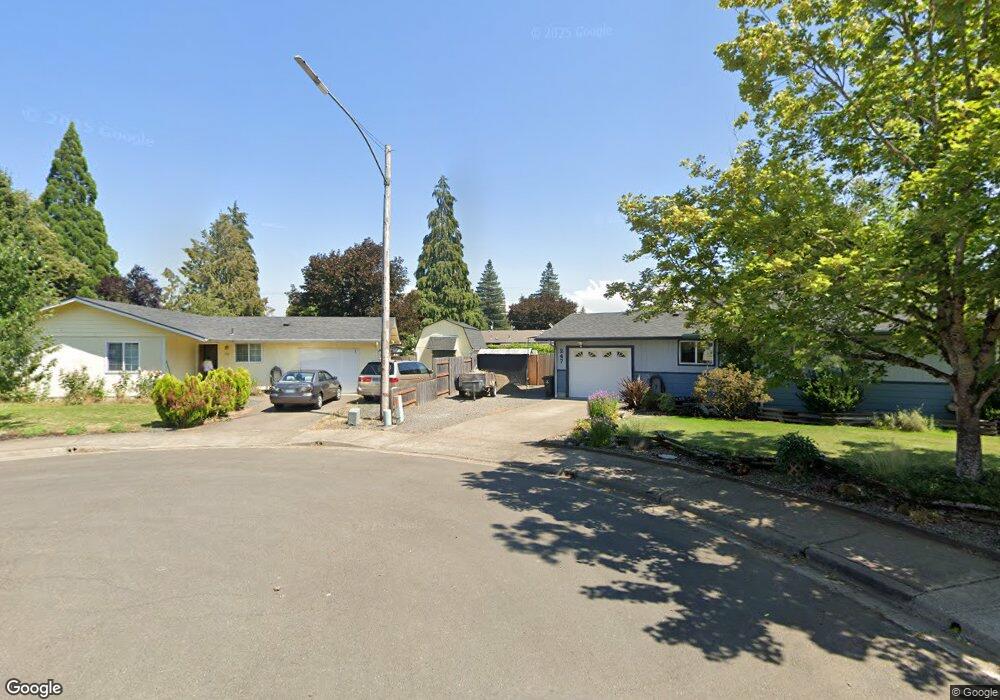
240 N 35th Ct Springfield, OR 97478
East Springfield NeighborhoodEstimated Value: $333,000 - $380,539
4
Beds
1
Bath
1,510
Sq Ft
$239/Sq Ft
Est. Value
About This Home
This home is located at 240 N 35th Ct, Springfield, OR 97478 and is currently estimated at $361,135, approximately $239 per square foot. 240 N 35th Ct is a home located in Lane County with nearby schools including Riverbend Elementary School, Briggs Middle School, and Thurston High School.
Ownership History
Date
Name
Owned For
Owner Type
Purchase Details
Closed on
Jun 29, 2001
Sold by
Branson Gary and Branson Dolores J
Bought by
Tucker Linda H
Current Estimated Value
Home Financials for this Owner
Home Financials are based on the most recent Mortgage that was taken out on this home.
Original Mortgage
$118,907
Outstanding Balance
$45,824
Interest Rate
7.14%
Mortgage Type
FHA
Estimated Equity
$315,311
Purchase Details
Closed on
Aug 8, 2000
Sold by
Wilson Ricky D
Bought by
Branson Gary and Branson Dolores J
Home Financials for this Owner
Home Financials are based on the most recent Mortgage that was taken out on this home.
Original Mortgage
$106,768
Interest Rate
8.19%
Mortgage Type
Seller Take Back
Create a Home Valuation Report for This Property
The Home Valuation Report is an in-depth analysis detailing your home's value as well as a comparison with similar homes in the area
Home Values in the Area
Average Home Value in this Area
Purchase History
| Date | Buyer | Sale Price | Title Company |
|---|---|---|---|
| Tucker Linda H | $120,000 | Evergreen Land Title Co | |
| Branson Gary | $134,500 | Key Title Company |
Source: Public Records
Mortgage History
| Date | Status | Borrower | Loan Amount |
|---|---|---|---|
| Open | Tucker Linda H | $118,907 | |
| Previous Owner | Branson Gary | $106,768 | |
| Closed | Tucker Linda H | $4,000 |
Source: Public Records
Tax History Compared to Growth
Tax History
| Year | Tax Paid | Tax Assessment Tax Assessment Total Assessment is a certain percentage of the fair market value that is determined by local assessors to be the total taxable value of land and additions on the property. | Land | Improvement |
|---|---|---|---|---|
| 2024 | $2,670 | $143,676 | -- | -- |
| 2023 | $2,670 | $139,492 | $0 | $0 |
| 2022 | $2,473 | $135,430 | $0 | $0 |
| 2021 | $2,428 | $131,486 | $0 | $0 |
| 2020 | $2,357 | $127,657 | $0 | $0 |
| 2019 | $2,287 | $123,939 | $0 | $0 |
| 2018 | $2,155 | $116,825 | $0 | $0 |
| 2017 | $2,073 | $116,825 | $0 | $0 |
| 2016 | $2,029 | $113,422 | $0 | $0 |
| 2015 | $1,971 | $110,118 | $0 | $0 |
| 2014 | $1,941 | $106,911 | $0 | $0 |
Source: Public Records
Map
Nearby Homes