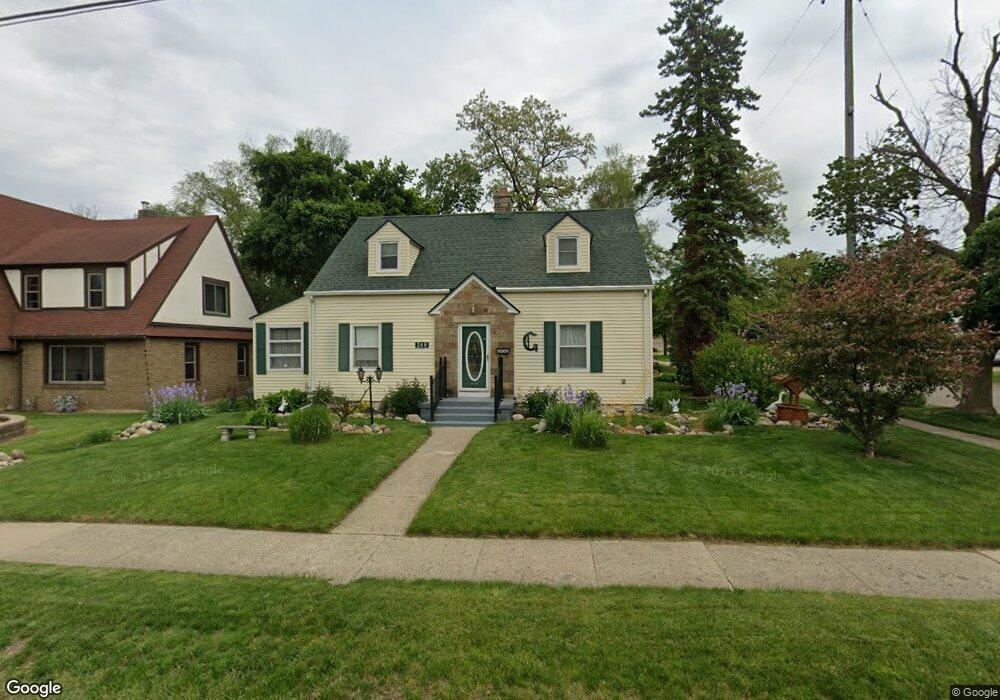
240 North Ave Battle Creek, MI 49017
Northeast Battle Creek NeighborhoodEstimated Value: $175,000 - $238,000
3
Beds
2
Baths
2,088
Sq Ft
$95/Sq Ft
Est. Value
About This Home
This home is located at 240 North Ave, Battle Creek, MI 49017 and is currently estimated at $199,361, approximately $95 per square foot. 240 North Ave is a home located in Calhoun County with nearby schools including Northwestern Middle School, Battle Creek Central High School, and St. Philip Catholic Central High School.
Ownership History
Date
Name
Owned For
Owner Type
Purchase Details
Closed on
May 16, 2023
Sold by
Martin Sharon L
Bought by
Martin Sharon L
Current Estimated Value
Purchase Details
Closed on
Aug 22, 2014
Sold by
Martin Sharon L
Bought by
Gitberg Donald B and Martin Sharon L
Purchase Details
Closed on
Feb 13, 2009
Sold by
Martin Harold B
Bought by
Martin Sharon L
Purchase Details
Closed on
Jul 30, 2002
Sold by
Johnson Patricia and Johnson Murphy Dorothy
Bought by
Martin Harold B and Martin Sharon L
Create a Home Valuation Report for This Property
The Home Valuation Report is an in-depth analysis detailing your home's value as well as a comparison with similar homes in the area
Home Values in the Area
Average Home Value in this Area
Purchase History
| Date | Buyer | Sale Price | Title Company |
|---|---|---|---|
| Martin Sharon L | -- | None Listed On Document | |
| Gitberg Donald B | -- | None Available | |
| Martin Sharon L | -- | None Available | |
| Martin Harold B | $28,500 | -- |
Source: Public Records
Tax History Compared to Growth
Tax History
| Year | Tax Paid | Tax Assessment Tax Assessment Total Assessment is a certain percentage of the fair market value that is determined by local assessors to be the total taxable value of land and additions on the property. | Land | Improvement |
|---|---|---|---|---|
| 2025 | -- | $83,900 | $0 | $0 |
| 2024 | $1,700 | $81,825 | $0 | $0 |
| 2023 | $1,943 | $69,179 | $0 | $0 |
| 2022 | $1,943 | $64,246 | $0 | $0 |
| 2021 | $1,833 | $62,358 | $0 | $0 |
| 2020 | $1,724 | $51,016 | $0 | $0 |
| 2019 | $1,718 | $43,416 | $0 | $0 |
| 2018 | $1,718 | $42,109 | $1,006 | $41,103 |
| 2017 | $1,665 | $45,924 | $0 | $0 |
| 2016 | $1,662 | $39,334 | $0 | $0 |
| 2015 | $1,499 | $37,222 | $2,456 | $34,766 |
| 2014 | $1,499 | $37,915 | $2,456 | $35,459 |
Source: Public Records
Map
Nearby Homes