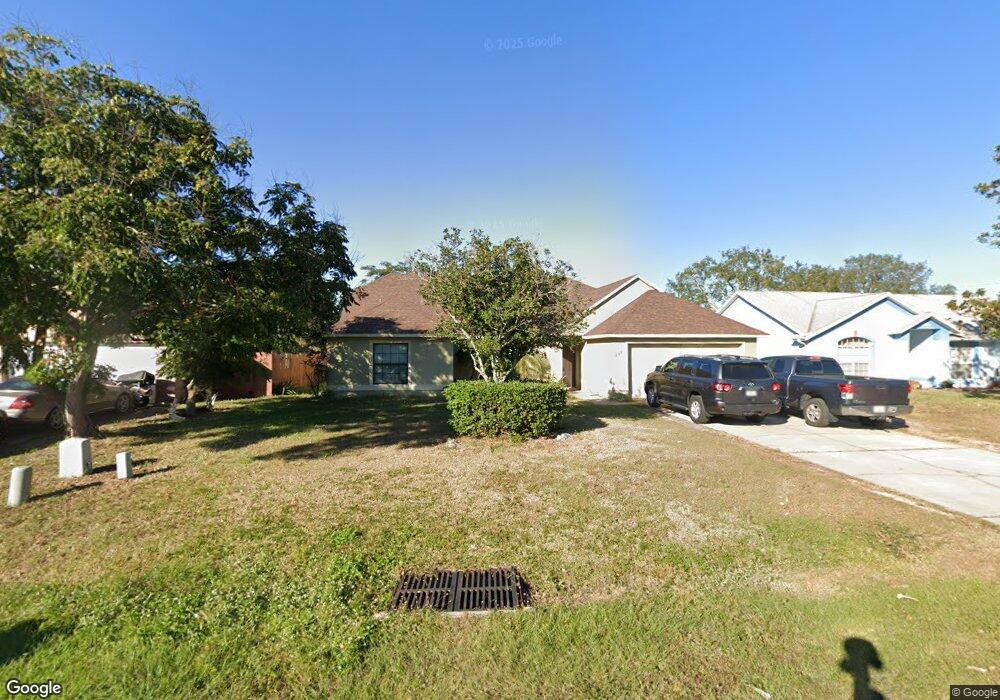
240 Robbins Rest Cir Davenport, FL 33896
Estimated Value: $344,000 - $369,561
3
Beds
2
Baths
1,662
Sq Ft
$215/Sq Ft
Est. Value
About This Home
This home is located at 240 Robbins Rest Cir, Davenport, FL 33896 and is currently estimated at $356,640, approximately $214 per square foot. 240 Robbins Rest Cir is a home located in Polk County with nearby schools including Davenport School Of The Arts, Loughman Oaks Elementary School, and Dundee Elementary Academy.
Ownership History
Date
Name
Owned For
Owner Type
Purchase Details
Closed on
May 17, 2007
Sold by
Boren Richard and Boren Pauline
Bought by
Redgrave Richard
Current Estimated Value
Home Financials for this Owner
Home Financials are based on the most recent Mortgage that was taken out on this home.
Original Mortgage
$53,000
Outstanding Balance
$32,307
Interest Rate
6.12%
Mortgage Type
Stand Alone Second
Estimated Equity
$324,333
Purchase Details
Closed on
Dec 28, 2004
Sold by
Boren Richard and Boren Pauline
Bought by
Boren Sean M
Purchase Details
Closed on
Feb 19, 2004
Sold by
Boren Richard and Boren Pauline
Bought by
Boren Richard and Boren Pauline
Purchase Details
Closed on
Sep 30, 2003
Sold by
El Sergany Yasser and El Sergany Janet
Bought by
Boren Richard and Boren Pauline
Home Financials for this Owner
Home Financials are based on the most recent Mortgage that was taken out on this home.
Original Mortgage
$126,400
Interest Rate
6.45%
Mortgage Type
Purchase Money Mortgage
Create a Home Valuation Report for This Property
The Home Valuation Report is an in-depth analysis detailing your home's value as well as a comparison with similar homes in the area
Home Values in the Area
Average Home Value in this Area
Purchase History
| Date | Buyer | Sale Price | Title Company |
|---|---|---|---|
| Redgrave Richard | $132,500 | Aaa Title Agency Inc | |
| Redgrave Richard | $132,500 | Aaa Title Agency Inc | |
| Boren Sean M | -- | -- | |
| Boren Richard | -- | -- | |
| Boren Richard | $158,000 | -- |
Source: Public Records
Mortgage History
| Date | Status | Borrower | Loan Amount |
|---|---|---|---|
| Open | Redgrave Richard | $53,000 | |
| Closed | Redgrave Richard | $53,000 | |
| Open | Redgrave Richard | $212,000 | |
| Closed | Redgrave Richard | $212,000 | |
| Previous Owner | Boren Richard | $126,400 |
Source: Public Records
Tax History Compared to Growth
Tax History
| Year | Tax Paid | Tax Assessment Tax Assessment Total Assessment is a certain percentage of the fair market value that is determined by local assessors to be the total taxable value of land and additions on the property. | Land | Improvement |
|---|---|---|---|---|
| 2025 | $1,330 | $96,216 | -- | -- |
| 2024 | $1,160 | $93,504 | -- | -- |
| 2023 | $1,160 | $90,781 | $0 | $0 |
| 2022 | $1,103 | $88,137 | $0 | $0 |
| 2021 | $1,100 | $85,570 | $0 | $0 |
| 2020 | $1,068 | $84,389 | $0 | $0 |
| 2018 | $958 | $78,186 | $0 | $0 |
| 2017 | $938 | $76,578 | $0 | $0 |
| 2016 | $888 | $75,003 | $0 | $0 |
| 2015 | $554 | $74,482 | $0 | $0 |
| 2014 | $838 | $73,891 | $0 | $0 |
Source: Public Records
Map
Nearby Homes
- 307 Balmoral Ct
- 407 Darlington Loop
- 172 Villa Domani Ct
- 196 Villa Domani Ct
- 175 Villa Domani Cir
- 204 Villa Domani Cir
- 222 Darlington Loop
- 205 Villa Domani Cir Unit 62
- 212 Villa Domani Cir
- 236 Villa Domani Cir
- 316 Villa Domani Ct
- 235 Villa Domani Cir
- 324 Pine Lake View Dr
- 248 Arbor Lakes Dr
- 100 Sunridge Woods Ct
- 143 Hollingshead Loop
- 470 Lake Shore Pkwy
- 450 Lake Shore Pkwy
- 486 Lake Shore Pkwy
- 454 Lake Shore Pkwy
- 234 Robbins Rest Cir
- 246 Robbins Rest Cir
- 228 Robbins Rest Cir
- 252 Robbins Rest Cir
- 222 Robbins Rest Cir
- 239 Robbins Rest Cir
- 233 Robbins Rest Cir
- 258 Robbins Rest Cir
- 317 Robbins Rest Cir
- 227 Robbins Rest Cir
- 216 Robbins Rest Cir
- 221 Robbins Rest Cir
- 323 Robbins Rest Cir
- 306 Robbins Rest Cir
- 210 Robbins Rest Cir
- 128 Robbins Rest Ct
- 134 Robbins Rest Place
- 312 Robbins Rest Cir
- 125 Robbins Rest Place
- 329 Robbins Rest Cir