240 Rocky River Shores Dr Rock Island, TN 38581
Estimated Value: $564,246 - $890,000
--
Bed
--
Bath
2,264
Sq Ft
$289/Sq Ft
Est. Value
About This Home
This home is located at 240 Rocky River Shores Dr, Rock Island, TN 38581 and is currently estimated at $655,312, approximately $289 per square foot. 240 Rocky River Shores Dr is a home with nearby schools including Spencer Elementary School and Van Buren County High School.
Ownership History
Date
Name
Owned For
Owner Type
Purchase Details
Closed on
Jun 9, 2009
Sold by
Sullivan Charles Jason
Bought by
Lowe William T
Current Estimated Value
Home Financials for this Owner
Home Financials are based on the most recent Mortgage that was taken out on this home.
Original Mortgage
$58,600
Outstanding Balance
$36,745
Interest Rate
4.79%
Mortgage Type
New Conventional
Estimated Equity
$618,567
Purchase Details
Closed on
Sep 14, 2007
Sold by
Yates Tommy W
Bought by
Jason Sullivan Charles
Purchase Details
Closed on
Jul 18, 2006
Sold by
Walker Roy L
Bought by
Yates Tommy W
Purchase Details
Closed on
Oct 8, 2000
Bought by
Walker Roy and Walker Norma
Purchase Details
Closed on
Sep 21, 1999
Bought by
Walker Roy and Walker Norma
Purchase Details
Closed on
Mar 1, 1999
Bought by
Tennessee Timberline Corp
Purchase Details
Closed on
Apr 19, 1983
Bought by
Savage James A and Savage Carolyn
Create a Home Valuation Report for This Property
The Home Valuation Report is an in-depth analysis detailing your home's value as well as a comparison with similar homes in the area
Home Values in the Area
Average Home Value in this Area
Purchase History
| Date | Buyer | Sale Price | Title Company |
|---|---|---|---|
| Lowe William T | $65,000 | -- | |
| Jason Sullivan Charles | $55,000 | -- | |
| Yates Tommy W | $33,000 | -- | |
| Walker Roy | -- | -- | |
| Walker Roy | -- | -- | |
| Tennessee Timberline Corp | -- | -- | |
| Savage James A | -- | -- |
Source: Public Records
Mortgage History
| Date | Status | Borrower | Loan Amount |
|---|---|---|---|
| Open | Savage James A | $58,600 |
Source: Public Records
Tax History Compared to Growth
Tax History
| Year | Tax Paid | Tax Assessment Tax Assessment Total Assessment is a certain percentage of the fair market value that is determined by local assessors to be the total taxable value of land and additions on the property. | Land | Improvement |
|---|---|---|---|---|
| 2025 | $2,074 | $86,425 | $0 | $0 |
| 2024 | $2,074 | $86,425 | $11,625 | $74,800 |
| 2023 | $2,074 | $86,425 | $11,625 | $74,800 |
| 2022 | $2,074 | $86,425 | $11,625 | $74,800 |
| 2021 | $2,074 | $86,425 | $11,625 | $74,800 |
| 2020 | $2,177 | $86,425 | $11,625 | $74,800 |
| 2019 | $1,822 | $78,875 | $10,400 | $68,475 |
| 2018 | $1,522 | $78,875 | $10,400 | $68,475 |
| 2017 | $1,522 | $78,875 | $10,400 | $68,475 |
| 2016 | $1,522 | $78,875 | $10,400 | $68,475 |
| 2015 | $1,522 | $78,875 | $10,400 | $68,475 |
| 2014 | $157 | $89,175 | $10,400 | $78,775 |
| 2013 | $157 | $8,588 | $0 | $0 |
Source: Public Records
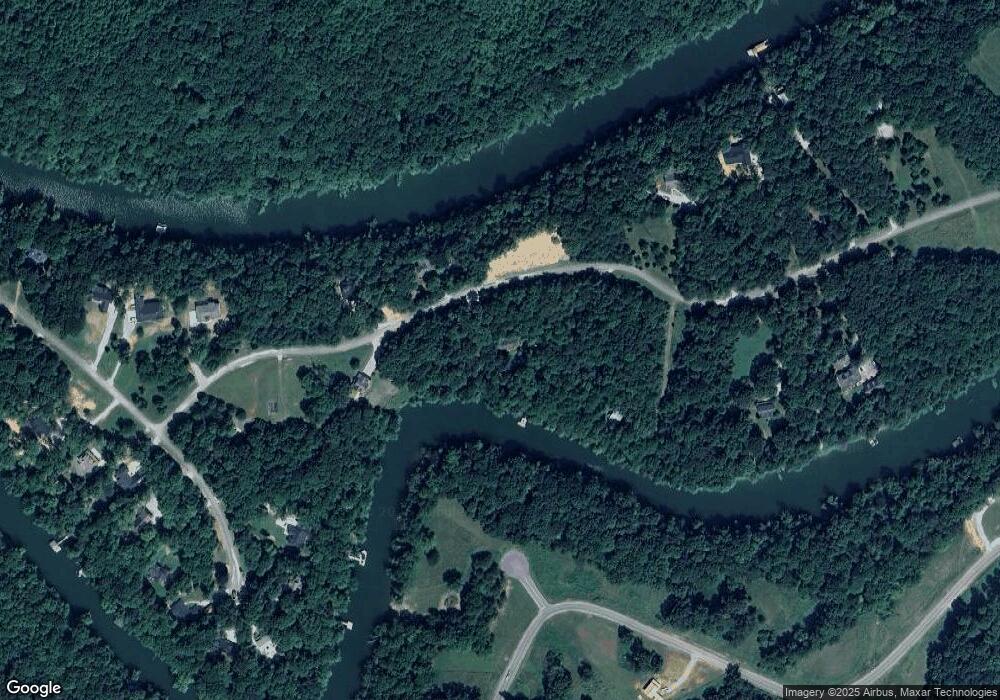
Map
Nearby Homes
- 115 Long Point Dr
- Lot 8 Hidden River Rd
- 2 Hidden River Rd
- 0 Rock Island Shores Ln
- 0 Hidden River Rd Unit RTC3050277
- 0 Hidden River Rd Unit RTC3059423
- 0 Hidden River Rd Unit 1315458
- 0 Hidden River Rd Unit RTC3050284
- 0 Hidden River Rd Unit RTC3050288
- 0 Hidden River Rd Unit RTC3052009
- 0 Hidden River Rd Unit RTC2882849
- 0 Hidden River Rd Unit RTC3042823
- 0 Hidden River Rd Unit RTC3033998
- 0 Hidden River Rd Unit RTC2806350
- 49 Hidden River Rd
- Lot 9 Hidden River Rd
- 0 Bone Cave Rd Unit RTC3048650
- 0 Bone Cave Rd Unit 1518019
- 622 Bone Cave Rd
- 617 Post Office Rd
- Lot 55 Rock Island Shores Dr
- 344 Rocky River Shores Dr
- 191 Rocky River Shores Dr
- 136 Rocky River Shores Dr
- Lot 54 Rock Island Shores Dr
- 325 Rocky River Shores Dr
- 396 Rocky River Shores Dr
- 63 Rocky River Shores Dr
- 34 Rocky River Shores Dr
- 0 Long Point Dr Unit 138281
- 0 Long Point Dr Unit 2202752
- 0 Long Point Dr Unit 2108744
- 0 Long Point Dr Unit 2058812
- 0 Long Point Dr Unit 2019762
- Lot 18 Rocky River Shores Dr
- 18 Rocky River Shores Dr
- 26 Long Point Dr
- 444 Rocky River Shores Dr
- 6 Long Point Dr
- 3 Ac Rocky River Shore Dr