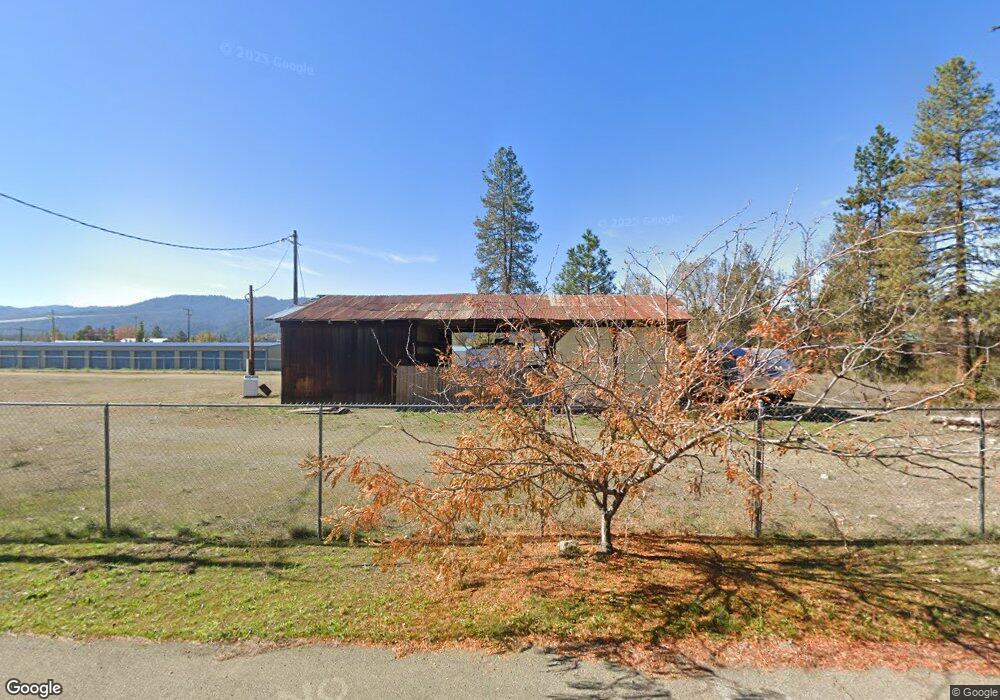
240 Tule Creek Rd Hayfork, CA 96041
Estimated Value: $414,320 - $420,000
--
Bed
--
Bath
8,000
Sq Ft
$52/Sq Ft
Est. Value
About This Home
This home is located at 240 Tule Creek Rd, Hayfork, CA 96041 and is currently estimated at $417,160, approximately $52 per square foot. 240 Tule Creek Rd is a home located in Trinity County with nearby schools including Hayfork High School.
Ownership History
Date
Name
Owned For
Owner Type
Purchase Details
Closed on
Jun 1, 2015
Sold by
The Van Patton Garrett Revocable Living
Bought by
Pacific Holdings Land Trust
Current Estimated Value
Home Financials for this Owner
Home Financials are based on the most recent Mortgage that was taken out on this home.
Original Mortgage
$115,000
Outstanding Balance
$88,655
Interest Rate
3.62%
Mortgage Type
New Conventional
Estimated Equity
$328,505
Purchase Details
Closed on
May 9, 2007
Sold by
Mccoy Gerald A and Mccoy Bonnie L
Bought by
Garrett Van Patton
Create a Home Valuation Report for This Property
The Home Valuation Report is an in-depth analysis detailing your home's value as well as a comparison with similar homes in the area
Home Values in the Area
Average Home Value in this Area
Purchase History
| Date | Buyer | Sale Price | Title Company |
|---|---|---|---|
| Pacific Holdings Land Trust | $230,000 | Trinity County Title Company | |
| Garrett Van Patton | $47,000 | Trinity Co Title Co |
Source: Public Records
Mortgage History
| Date | Status | Borrower | Loan Amount |
|---|---|---|---|
| Open | Pacific Holdings Land Trust | $115,000 |
Source: Public Records
Tax History Compared to Growth
Tax History
| Year | Tax Paid | Tax Assessment Tax Assessment Total Assessment is a certain percentage of the fair market value that is determined by local assessors to be the total taxable value of land and additions on the property. | Land | Improvement |
|---|---|---|---|---|
| 2025 | $4,092 | $352,940 | $215,500 | $137,440 |
| 2024 | $4,108 | $353,800 | $215,500 | $138,300 |
| 2023 | $4,108 | $353,380 | $215,500 | $137,880 |
| 2022 | $5,224 | $454,700 | $242,896 | $211,804 |
| 2021 | $4,805 | $443,729 | $238,134 | $205,595 |
| 2020 | $3,881 | $351,000 | $100,000 | $251,000 |
| 2019 | $4,757 | $434,950 | $233,465 | $201,485 |
| 2018 | $4,645 | $427,942 | $228,888 | $199,054 |
| 2017 | $4,604 | $417,100 | $224,400 | $192,700 |
| 2016 | $2,638 | $234,600 | $224,400 | $10,200 |
| 2015 | $755 | $52,387 | $46,817 | $5,570 |
| 2014 | $748 | $51,361 | $45,900 | $5,461 |
Source: Public Records
Map
Nearby Homes
- 67 Highland Dr
- 238 Circle Dr
- 379 Highland Dr
- 675 Hyampom
- 7020 California 3
- 7011 California 3
- 7021 California 3
- Financing Miningclaim Ownership
- 125 Cedar Gulch Rd
- 120 Humboldt St
- 510 Oliva Dr
- 70 Oak Ave
- 305 Pine Ave
- 355 Pine Ave
- 820 Kingsbury Rd
- 131 Locust St
- 63 Michel St
- 310 Reservoir Rd
- 355 Oliva Dr
- 86 Donald St