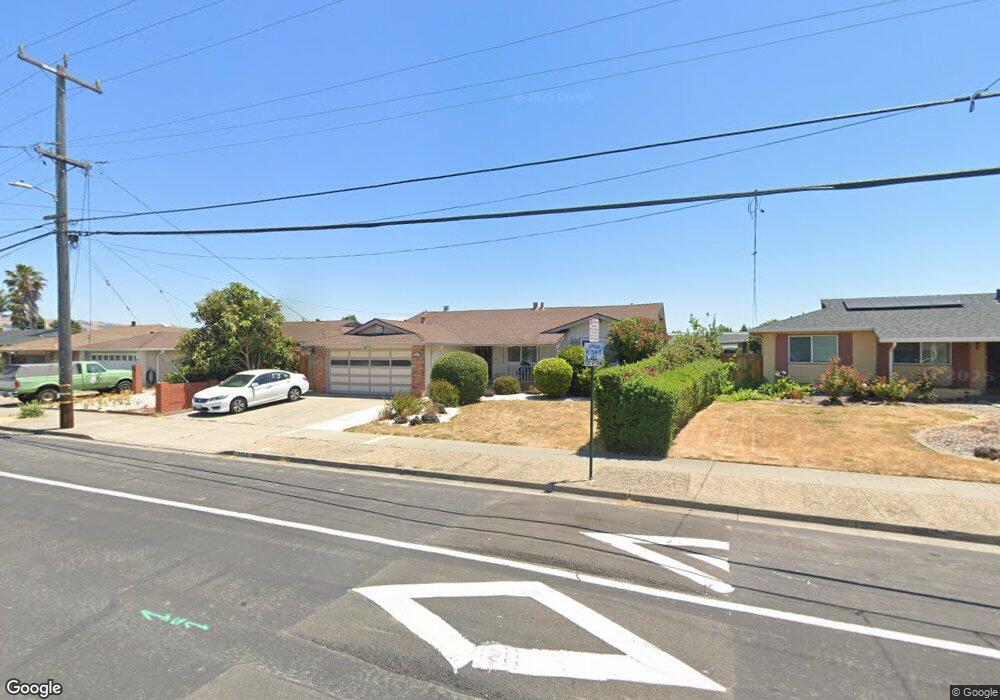
2400 Catalpa Way Hayward, CA 94545
Glen Eden NeighborhoodEstimated Value: $892,000 - $988,815
4
Beds
2
Baths
1,358
Sq Ft
$693/Sq Ft
Est. Value
About This Home
This home is located at 2400 Catalpa Way, Hayward, CA 94545 and is currently estimated at $940,454, approximately $692 per square foot. 2400 Catalpa Way is a home located in Alameda County with nearby schools including Palma Ceia Elementary School, Anthony W. Ochoa Middle School, and Mt. Eden High School.
Ownership History
Date
Name
Owned For
Owner Type
Purchase Details
Closed on
Feb 16, 2018
Sold by
Quraishi Feda M
Bought by
Wong Chad King and Lin Naing Zaw
Current Estimated Value
Home Financials for this Owner
Home Financials are based on the most recent Mortgage that was taken out on this home.
Original Mortgage
$518,000
Outstanding Balance
$438,699
Interest Rate
3.99%
Mortgage Type
New Conventional
Estimated Equity
$501,755
Purchase Details
Closed on
Feb 2, 2009
Sold by
Quraishi Wasfia
Bought by
Quraishi Feda M
Home Financials for this Owner
Home Financials are based on the most recent Mortgage that was taken out on this home.
Original Mortgage
$243,750
Interest Rate
5.04%
Mortgage Type
Purchase Money Mortgage
Purchase Details
Closed on
Jul 28, 2008
Sold by
Ticas Ana
Bought by
Countrywide Bank Fsb
Purchase Details
Closed on
Feb 28, 2006
Sold by
Ticas Ana
Bought by
Ticas Ana and Copland Rossana
Purchase Details
Closed on
Apr 14, 2005
Sold by
Ticas Ana and Copland Rossana Marleny
Bought by
Ticas Ana
Home Financials for this Owner
Home Financials are based on the most recent Mortgage that was taken out on this home.
Original Mortgage
$431,000
Interest Rate
6.93%
Mortgage Type
New Conventional
Purchase Details
Closed on
May 27, 2004
Sold by
Ticas Ana
Bought by
Ticas Ana and Copland Rossana Marleny
Home Financials for this Owner
Home Financials are based on the most recent Mortgage that was taken out on this home.
Original Mortgage
$376,000
Interest Rate
5.55%
Mortgage Type
Purchase Money Mortgage
Purchase Details
Closed on
Aug 19, 2003
Sold by
Tzintzun Sergio
Bought by
Copland Rossana Marleny
Purchase Details
Closed on
Aug 15, 2003
Sold by
Cortez Amilcar and Ticas Ana
Bought by
Ticas Ana and Copland Rossana Marleny
Purchase Details
Closed on
May 1, 2003
Sold by
Cortez Teresa Dejesus
Bought by
Cortez Amilcar
Home Financials for this Owner
Home Financials are based on the most recent Mortgage that was taken out on this home.
Original Mortgage
$328,000
Interest Rate
5.62%
Purchase Details
Closed on
Apr 24, 2003
Sold by
Rapp Robert Paul and Bjourklund Winoma Mae
Bought by
Cortez Amilcar R and Ticas Ana
Home Financials for this Owner
Home Financials are based on the most recent Mortgage that was taken out on this home.
Original Mortgage
$328,000
Interest Rate
5.62%
Purchase Details
Closed on
Mar 23, 1995
Sold by
Rapp George P and Rapp Thelma R
Bought by
Rapp George Paul and Rapp Thelma Ruth
Create a Home Valuation Report for This Property
The Home Valuation Report is an in-depth analysis detailing your home's value as well as a comparison with similar homes in the area
Home Values in the Area
Average Home Value in this Area
Purchase History
| Date | Buyer | Sale Price | Title Company |
|---|---|---|---|
| Wong Chad King | $740,000 | Chicago Title Company | |
| Quraishi Feda M | -- | First American Title Company | |
| Quraishi Feda M | $325,000 | First American Title Company | |
| Countrywide Bank Fsb | $312,375 | Landsafe Title | |
| Ticas Ana | -- | None Available | |
| Ticas Ana | -- | Alliance Title Company | |
| Ticas Ana | -- | Financial Title Company | |
| Ticas Ana | $218,136 | Financial Title Company | |
| Copland Rossana Marleny | -- | Commonwealth Land Title Co | |
| Ticas Ana | -- | -- | |
| Cortez Amilcar | -- | Commonwealth Land Title Co | |
| Cortez Amilcar R | $410,000 | Commonwealth Land Title Co | |
| Rapp George Paul | -- | -- |
Source: Public Records
Mortgage History
| Date | Status | Borrower | Loan Amount |
|---|---|---|---|
| Open | Wong Chad King | $518,000 | |
| Previous Owner | Quraishi Feda M | $243,750 | |
| Previous Owner | Ticas Ana | $431,000 | |
| Previous Owner | Ticas Ana | $376,000 | |
| Previous Owner | Cortez Amilcar R | $328,000 | |
| Closed | Cortez Amilcar R | $82,000 | |
| Closed | Ticas Ana | $53,000 |
Source: Public Records
Tax History Compared to Growth
Tax History
| Year | Tax Paid | Tax Assessment Tax Assessment Total Assessment is a certain percentage of the fair market value that is determined by local assessors to be the total taxable value of land and additions on the property. | Land | Improvement |
|---|---|---|---|---|
| 2025 | $10,153 | $841,978 | $252,593 | $589,385 |
| 2024 | $10,153 | $825,470 | $247,641 | $577,829 |
| 2023 | $10,001 | $809,285 | $242,785 | $566,500 |
| 2022 | $9,806 | $793,420 | $238,026 | $555,394 |
| 2021 | $9,727 | $777,865 | $233,359 | $544,506 |
| 2020 | $9,618 | $769,895 | $230,968 | $538,927 |
| 2019 | $9,698 | $754,800 | $226,440 | $528,360 |
| 2018 | $4,621 | $367,811 | $110,343 | $257,468 |
| 2017 | $4,515 | $360,600 | $108,180 | $252,420 |
| 2016 | $4,252 | $353,531 | $106,059 | $247,472 |
| 2015 | $4,167 | $348,224 | $104,467 | $243,757 |
| 2014 | $3,960 | $341,405 | $102,421 | $238,984 |
Source: Public Records
Map
Nearby Homes
- 2329 Bridwell Way
- 2284 Bourbon Dr Unit 61
- 28290 Applegate St
- 2187 Bourbon Dr
- 2380 Cabrillo Dr
- 28399 Cubberley Ct
- 2553 Phelan Ave
- 2168 Keys Place
- 2072 Everglade St
- 1925 Lilac Ave
- 2421 Arf Ave
- 27956 Emerson Ave
- 27726 Del Norte Ct
- 28530 Gulfport Cir
- 1835 Egret Ln
- 27801 Del Norte Ct
- 27949 Pueblo Serena Unit 78
- 2564 Anchorage Place
- 27707 La Porte Ave
- 2452 Oliver Dr
- 2388 Catalpa Way
- 2418 Catalpa Way
- 2417 Bridwell Way
- 2409 Bridwell Way
- 2364 Catalpa Way
- 2446 Catalpa Way
- 2433 Bridwell Way
- 2399 Catalpa Way
- 2383 Bridwell Way
- 2381 Catalpa Way
- 2346 Catalpa Way
- 2416 Bridwell Way
- 2417 Catalpa Way
- 2452 Catalpa Way
- 2363 Catalpa Way
- 2432 Bridwell Way
- 2345 Catalpa Way
- 2328 Catalpa Way
- 2347 Bridwell Way
- 28353 Chambers St