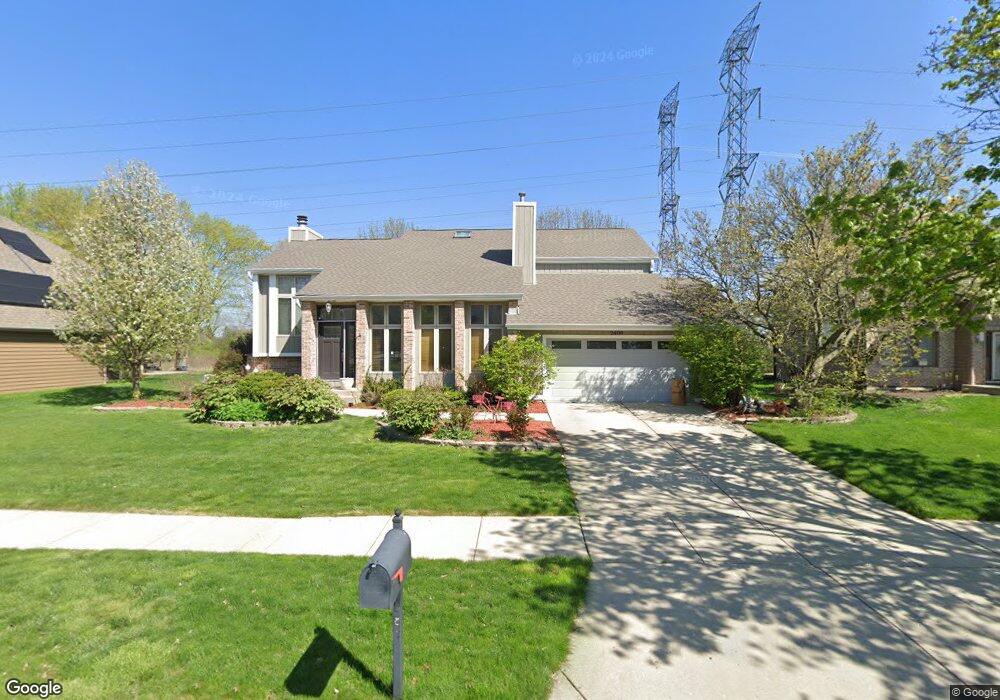
2400 Chandler Ct Unit 36 Aurora, IL 60502
Eola Yards NeighborhoodEstimated Value: $498,000 - $744,000
4
Beds
3
Baths
2,994
Sq Ft
$219/Sq Ft
Est. Value
About This Home
This home is located at 2400 Chandler Ct Unit 36, Aurora, IL 60502 and is currently estimated at $656,990, approximately $219 per square foot. 2400 Chandler Ct Unit 36 is a home located in DuPage County with nearby schools including Gwendolyn Brooks Elementary School, Francis Granger Middle School, and Metea Valley High School.
Ownership History
Date
Name
Owned For
Owner Type
Purchase Details
Closed on
Nov 17, 2017
Sold by
Dillon Mark D and Dillon Debra L
Bought by
Kapila Rajanikanth and Kapila Nivedita
Current Estimated Value
Home Financials for this Owner
Home Financials are based on the most recent Mortgage that was taken out on this home.
Original Mortgage
$328,000
Outstanding Balance
$272,938
Interest Rate
3.59%
Estimated Equity
$384,052
Purchase Details
Closed on
Aug 21, 2002
Sold by
Tetzlaff David A and Tetzlaff Helen H
Bought by
Dillon Mark D and Dillon Debra L
Home Financials for this Owner
Home Financials are based on the most recent Mortgage that was taken out on this home.
Original Mortgage
$270,000
Interest Rate
6.24%
Purchase Details
Closed on
May 10, 1996
Sold by
Burke Christine M
Bought by
Tetzlaff David A and Tetzlaff Helen H
Home Financials for this Owner
Home Financials are based on the most recent Mortgage that was taken out on this home.
Original Mortgage
$192,500
Interest Rate
7.97%
Mortgage Type
Balloon
Create a Home Valuation Report for This Property
The Home Valuation Report is an in-depth analysis detailing your home's value as well as a comparison with similar homes in the area
Home Values in the Area
Average Home Value in this Area
Purchase History
| Date | Buyer | Sale Price | Title Company |
|---|---|---|---|
| Kapila Rajanikanth | $410,000 | North National Title | |
| Dillon Mark D | $349,000 | First American Title | |
| Tetzlaff David A | $275,000 | -- |
Source: Public Records
Mortgage History
| Date | Status | Borrower | Loan Amount |
|---|---|---|---|
| Open | Kapila Rajanikanth | $328,000 | |
| Previous Owner | Dillon Mark D | $270,000 | |
| Previous Owner | Tetzlaff David A | $192,500 |
Source: Public Records
Tax History Compared to Growth
Tax History
| Year | Tax Paid | Tax Assessment Tax Assessment Total Assessment is a certain percentage of the fair market value that is determined by local assessors to be the total taxable value of land and additions on the property. | Land | Improvement |
|---|---|---|---|---|
| 2024 | $11,013 | $152,846 | $33,810 | $119,036 |
| 2023 | $10,511 | $137,340 | $30,380 | $106,960 |
| 2022 | $9,951 | $124,660 | $27,350 | $97,310 |
| 2021 | $9,689 | $120,210 | $26,370 | $93,840 |
| 2020 | $9,807 | $120,210 | $26,370 | $93,840 |
| 2019 | $9,464 | $114,330 | $25,080 | $89,250 |
| 2018 | $10,092 | $120,260 | $26,170 | $94,090 |
| 2017 | $9,927 | $116,180 | $25,280 | $90,900 |
| 2016 | $9,755 | $111,500 | $24,260 | $87,240 |
| 2015 | $9,659 | $105,860 | $23,030 | $82,830 |
| 2014 | $10,158 | $107,950 | $23,290 | $84,660 |
| 2013 | $10,052 | $108,700 | $23,450 | $85,250 |
Source: Public Records
Map
Nearby Homes
- 2428 Ridgewood Ct
- 2762 Shetland Ln
- 1176 Heathrow Ln
- 1148 Drury Ln
- 1648 Mcclure Rd Unit 814
- 1129 Drury Ln
- 1942 Tall Oaks Dr Unit 1A
- 1771 Briarheath Dr
- 1425 Mcclure Rd Unit 10
- 970 Waterside Ct
- 1953 Charles Ln Unit 1953
- 2315 Nan St
- 2634 Oakshire Ct
- 1110 Oakhill Dr
- Lot 1 Reckinger Rd
- 1826 N Farnsworth Ave
- 322 4th St
- 1671 Sheffer Rd
- 1229 Pennsbury Ln
- 1750 N Marywood Ave Unit 315
- 2390 Chandler Ct
- 2410 Chandler Ct
- 2380 Chandler Ct
- 2420 Chandler Ct
- 2405 Chandler Ct
- 2415 Chandler Ct
- 1530 Birmingham Dr
- 2430 Chandler Ct Unit 36
- 2370 Chandler Ct Unit 36
- 2425 Chandler Ct
- 2375 Chandler Ct Unit 36
- 2435 Chandler Ct
- 2360 Chandler Ct
- 2402 Wentworth Ln
- 2412 Wentworth Ln
- 1520 Birmingham Dr Unit 36
- 2365 Chandler Ct
- 2422 Wentworth Ln Unit 36
- 2350 Chandler Ct
- 2432 Wentworth Ln