
Seller's Agent in 2026
Diana Stasey
Stasey Real Estate
(469) 667-7940
1 in this area
23 Total Sales
Estimated Value: $190,452 - $212,000
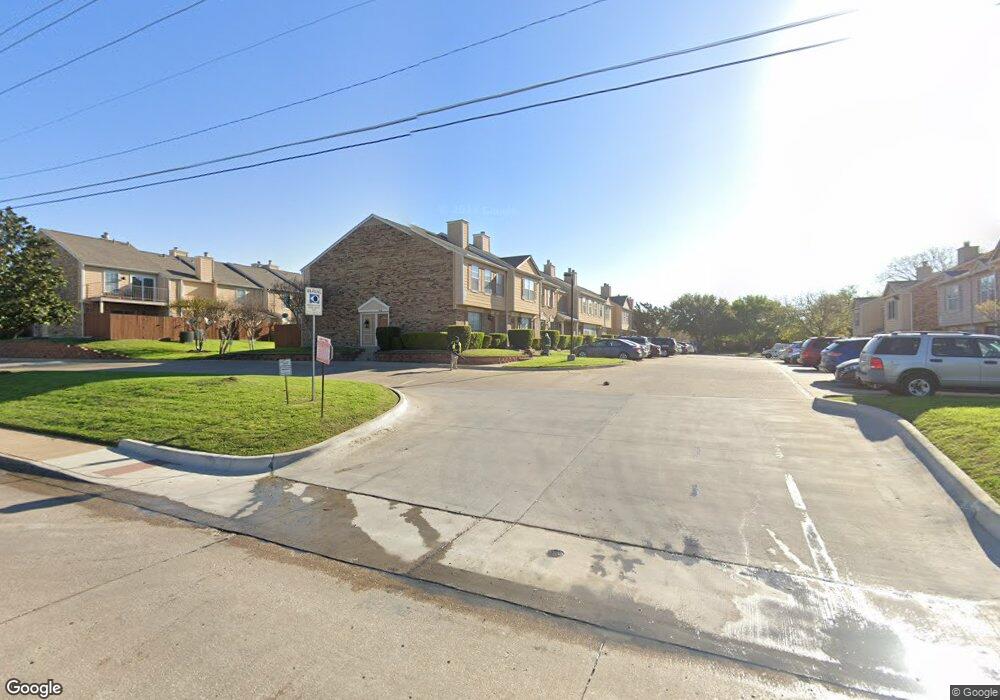
Updated Condo in PISD & Briarpark Village! Right across from Willow Creek Park. Community Pool is a brisk walk from Building D. Modern light fixtures, flooring and cabinets. Granite countertops in Kitchen & Bath. Great layout, with open floor plan and eat-in Kitchen. Large Master bedroom with oversized balcony. Large painted-brick, wood-burning fireplace, in spacious Living room. Easy access to Hwy 75 & George Bush, plenty of shopping and eating near by. Washer and Dryer units included.
| Date | Buyer | Sale Price | Title Company |
|---|---|---|---|
| Big Top Mountian Llc | -- | None Available | |
| Big Blue Management Group Llc | -- | None Available | |
| Thulluri Sarayu | -- | None Available |
| Date | Status | Borrower | Loan Amount |
|---|---|---|---|
| Previous Owner | Big Blue Management Group Llc | $100,000 | |
| Previous Owner | Thulluri Sarayu | $59,850 |
| Date | Event | Price | List to Sale | Price per Sq Ft | Prior Sale |
|---|---|---|---|---|---|
| 03/19/2026 03/19/26 | Rented | $1,350 | 0.0% | -- | |
| 03/12/2026 03/12/26 | Price Changed | $1,350 | -3.6% | $2 / Sq Ft | |
| 02/05/2026 02/05/26 | Price Changed | $1,400 | -3.4% | $2 / Sq Ft | |
| 01/08/2026 01/08/26 | Price Changed | $1,450 | -3.3% | $2 / Sq Ft | |
| 11/22/2025 11/22/25 | For Rent | $1,500 | +8.3% | -- | |
| 08/29/2025 08/29/25 | Rented | $1,385 | 0.0% | -- | |
| 08/13/2025 08/13/25 | Under Contract | -- | -- | -- | |
| 07/25/2025 07/25/25 | Price Changed | $1,385 | -4.5% | $2 / Sq Ft | |
| 06/19/2025 06/19/25 | Price Changed | $1,450 | -3.0% | $2 / Sq Ft | |
| 05/28/2025 05/28/25 | Price Changed | $1,495 | -3.5% | $2 / Sq Ft | |
| 05/07/2025 05/07/25 | For Rent | $1,550 | +72.2% | -- | |
| 04/29/2025 04/29/25 | Rented | -- | -- | -- | |
| 04/29/2025 04/29/25 | Rented | $900 | -5.3% | -- | |
| 03/14/2025 03/14/25 | For Rent | $950 | -40.6% | -- | |
| 03/18/2024 03/18/24 | Rented | $1,600 | 0.0% | -- | |
| 02/27/2024 02/27/24 | Price Changed | $1,600 | -5.6% | $2 / Sq Ft | |
| 02/13/2024 02/13/24 | Price Changed | $1,695 | -3.1% | $2 / Sq Ft | |
| 01/22/2024 01/22/24 | For Rent | $1,750 | +2.9% | -- | |
| 05/12/2023 05/12/23 | Rented | $1,700 | 0.0% | -- | |
| 05/05/2023 05/05/23 | Price Changed | $1,700 | -1.4% | $2 / Sq Ft | |
| 04/27/2023 04/27/23 | Price Changed | $1,725 | -1.4% | $2 / Sq Ft | |
| 04/17/2023 04/17/23 | For Rent | $1,750 | +6.1% | -- | |
| 08/15/2022 08/15/22 | Rented | $1,650 | -2.9% | -- | |
| 07/10/2022 07/10/22 | For Rent | $1,700 | 0.0% | -- | |
| 07/02/2022 07/02/22 | Under Contract | -- | -- | -- | |
| 07/01/2022 07/01/22 | For Rent | $1,700 | 0.0% | -- | |
| 06/25/2022 06/25/22 | Under Contract | -- | -- | -- | |
| 06/02/2022 06/02/22 | For Rent | $1,700 | +15.3% | -- | |
| 03/15/2022 03/15/22 | Rented | $1,475 | 0.0% | -- | |
| 03/14/2022 03/14/22 | Under Contract | -- | -- | -- | |
| 03/09/2022 03/09/22 | For Rent | $1,475 | 0.0% | -- | |
| 12/21/2021 12/21/21 | Sold | -- | -- | -- | View Prior Sale |
| 11/22/2021 11/22/21 | Pending | -- | -- | -- | |
| 11/09/2021 11/09/21 | For Sale | $165,000 | 0.0% | $206 / Sq Ft | |
| 03/27/2021 03/27/21 | Rented | $1,200 | 0.0% | -- | |
| 03/25/2021 03/25/21 | Under Contract | -- | -- | -- | |
| 02/12/2021 02/12/21 | For Rent | $1,200 | -- | -- | |
| 01/01/1970 01/01/70 | Off Market | -- | -- | -- |
| Year | Tax Paid | Tax Assessment Tax Assessment Total Assessment is a certain percentage of the fair market value that is determined by local assessors to be the total taxable value of land and additions on the property. | Land | Improvement |
|---|---|---|---|---|
| 2025 | $3,206 | $187,758 | $40,000 | $147,758 |
| 2024 | $3,018 | $194,432 | $40,000 | $138,496 |
| 2023 | $3,018 | $175,510 | $40,000 | $135,510 |
| 2022 | $3,227 | $168,859 | $40,000 | $128,859 |
| 2021 | $2,788 | $138,261 | $40,000 | $98,261 |
| 2020 | $2,639 | $129,245 | $40,000 | $89,245 |
| 2019 | $2,723 | $126,000 | $30,000 | $96,000 |
| 2018 | $2,070 | $94,984 | $25,000 | $85,216 |
| 2017 | $1,882 | $96,203 | $18,000 | $78,203 |
| 2016 | $1,733 | $91,844 | $5,280 | $86,564 |
| 2015 | $1,176 | $71,363 | $5,280 | $66,083 |
Seller's Agent in 2026
Diana Stasey
Stasey Real Estate
(469) 667-7940
1 in this area
23 Total Sales
M
Seller Co-Listing Agent in 2026
Mitch Newton
Stasey Real Estate
(469) 363-1978
17 Total Sales
M
Seller's Agent in 2025
Mian Javaid
United Real Estate
(646) 226-2690
2 Total Sales
Seller's Agent in 2025
Elisa Lo
Elite4Realty, LLC
(972) 978-7106
37 Total Sales
N
Buyer's Agent in 2025
Non-NTREIS MLS Licensee
NON MLS
Seller's Agent in 2024
Michael Slaughter
OmniKey Realty, LLC.
(833) 666-4539
2 in this area
42 Total Sales
Ask me questions while you tour the home.