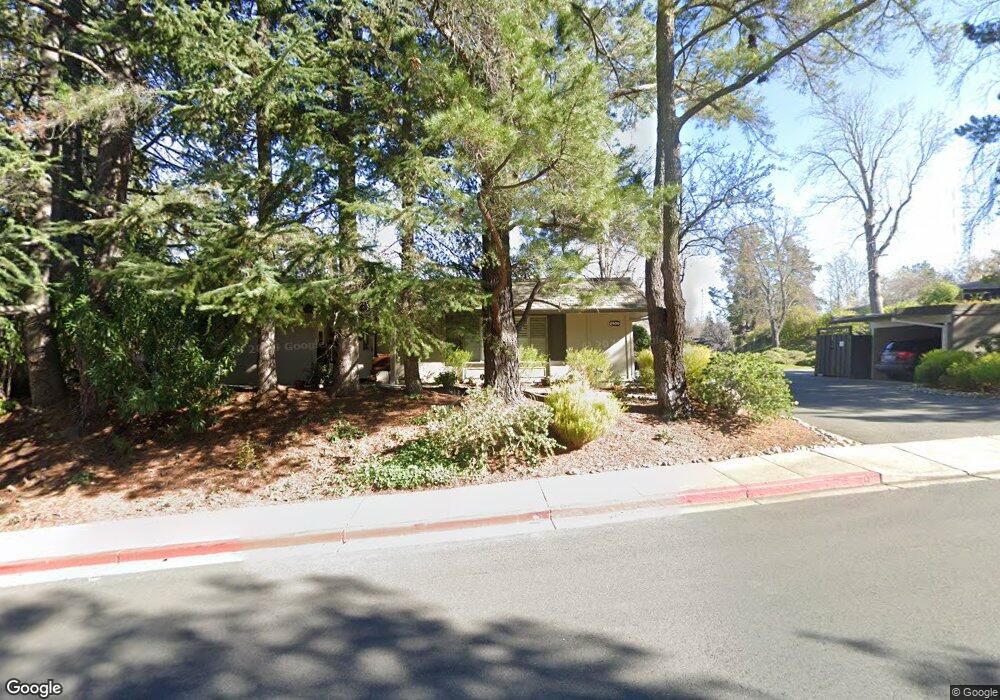
2400 Ptarmigan Dr Unit 1 Walnut Creek, CA 94595
Rossmoor NeighborhoodEstimated Value: $660,902 - $840,000
3
Beds
2
Baths
1,212
Sq Ft
$601/Sq Ft
Est. Value
About This Home
This home is located at 2400 Ptarmigan Dr Unit 1, Walnut Creek, CA 94595 and is currently estimated at $728,226, approximately $600 per square foot. 2400 Ptarmigan Dr Unit 1 is a home located in Contra Costa County with nearby schools including Parkmead Elementary School, Walnut Creek Intermediate School, and Las Lomas High School.
Ownership History
Date
Name
Owned For
Owner Type
Purchase Details
Closed on
May 25, 2016
Sold by
Mcneil Mary I
Bought by
Mcneil Mary I
Current Estimated Value
Purchase Details
Closed on
Oct 22, 2015
Sold by
Banard Christopher J
Bought by
Mcneil Mary I
Purchase Details
Closed on
Dec 10, 2010
Sold by
Beardsmore Carol A
Bought by
Beardsmore Carol A
Purchase Details
Closed on
Jul 7, 2010
Sold by
Mccampbell Linda S
Bought by
Beardsmore Carol A
Purchase Details
Closed on
Jun 25, 2008
Sold by
Mccampbell Linda S
Bought by
Mccampbell Linda S
Purchase Details
Closed on
Apr 28, 1999
Sold by
Prislin Elsie N Trust
Bought by
Mccampbell Kenneth H and Mccampbell Jane S
Create a Home Valuation Report for This Property
The Home Valuation Report is an in-depth analysis detailing your home's value as well as a comparison with similar homes in the area
Home Values in the Area
Average Home Value in this Area
Purchase History
| Date | Buyer | Sale Price | Title Company |
|---|---|---|---|
| Mcneil Mary I | -- | None Available | |
| Mcneil Mary I | $605,000 | Old Republic Title Company | |
| Beardsmore Carol A | -- | None Available | |
| Beardsmore Carol A | $249,000 | North American Title Co Inc | |
| Mccampbell Linda S | -- | None Available | |
| Mccampbell Linda S | -- | None Available | |
| Mccampbell Kenneth H | $239,000 | North American Title Co |
Source: Public Records
Tax History Compared to Growth
Tax History
| Year | Tax Paid | Tax Assessment Tax Assessment Total Assessment is a certain percentage of the fair market value that is determined by local assessors to be the total taxable value of land and additions on the property. | Land | Improvement |
|---|---|---|---|---|
| 2025 | $3,914 | $269,032 | $80,218 | $188,814 |
| 2024 | $3,820 | $263,758 | $78,646 | $185,112 |
| 2023 | $3,820 | $258,587 | $77,104 | $181,483 |
| 2022 | $3,786 | $253,518 | $75,593 | $177,925 |
| 2021 | $3,683 | $248,548 | $74,111 | $174,437 |
| 2019 | $3,578 | $241,178 | $71,914 | $169,264 |
| 2018 | $3,472 | $236,450 | $70,504 | $165,946 |
| 2017 | $3,394 | $231,815 | $69,122 | $162,693 |
| 2016 | $3,314 | $227,270 | $67,767 | $159,503 |
| 2015 | $3,667 | $256,478 | $173,757 | $82,721 |
| 2014 | $3,667 | $251,455 | $170,354 | $81,101 |
Source: Public Records
Map
Nearby Homes
- 2217 Ptarmigan Dr Unit 2
- 1932 Ptarmigan Dr Unit 3
- 1932 Ptarmigan Dr Unit 1
- 1416 Canyonwood Ct Unit 4
- 1424 Canyonwood Ct Unit 1
- 1501 Canyonwood Ct Unit 12
- 1345 Singingwood Ct Unit 5
- 2101 Ptarmigan Dr Unit 2
- 1425 Canyonwood Ct
- 1332 Canyonwood Ct Unit 2
- 1333 Singingwood Ct Unit 1
- 1224 Canyonwood Ct Unit 2
- 1150 Canyonwood Ct Unit 4
- 1125 Singingwood Ct Unit 4
- 1125 Singingwood Ct Unit 1
- 3318 Ptarmigan Dr Unit 1B
- 1244 Singingwood Ct Unit 1
- 1405 Ptarmigan Dr Unit 1
- 3100 Terra Granada Dr Unit 2
- 1101 Singingwood Ct Unit 4
- 2400 Ptarmigan Dr Unit 2
- 2404 Ptarmigan Dr Unit 1
- 2404 Ptarmigan Dr Unit 2
- 2300 Ptarmigan Dr Unit 2
- 2300 Ptarmigan Dr Unit 1
- 2408 Ptarmigan Dr Unit 2
- 2408 Ptarmigan Dr Unit 1
- 2304 Ptarmigan Dr Unit 2
- 2304 Ptarmigan Dr Unit 1
- 2500 Ptarmigan Dr Unit 4
- 2500 Ptarmigan Dr Unit 3
- 2500 Ptarmigan Dr Unit 2
- 2500 Ptarmigan Dr Unit 1
- 2508 Ptarmigan Dr Unit 4
- 2508 Ptarmigan Dr Unit 3
- 2508 Ptarmigan Dr Unit 2
- 2508 Ptarmigan Dr Unit 1
- 2601 Ptarmigan Dr Unit 4
- 2601 Ptarmigan Dr Unit 3
- 2601 Ptarmigan Dr Unit 2