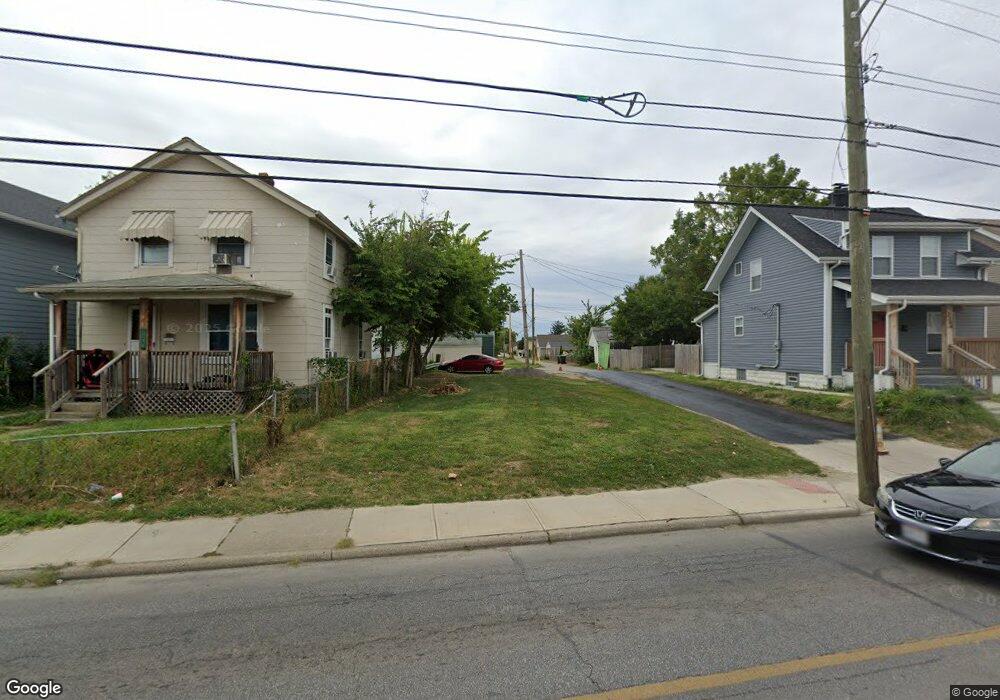
2400 Sullivant Ave Unit 402 Columbus, OH 43204
Central Hilltop Neighborhood
4
Beds
4
Baths
2,080
Sq Ft
4,356
Sq Ft Lot
About This Home
This home is located at 2400 Sullivant Ave Unit 402, Columbus, OH 43204. 2400 Sullivant Ave Unit 402 is a home located in Franklin County with nearby schools including Burroughs Elementary School, Hilltonia Middle School, and Briggs High School.
Ownership History
Date
Name
Owned For
Owner Type
Purchase Details
Closed on
May 17, 2021
Sold by
Central Ohio Community Improvement Corp
Bought by
City Of Columbus
Purchase Details
Closed on
Feb 21, 2017
Sold by
Clark F N
Bought by
Central Ohio Commounity Improvement Corp
Purchase Details
Closed on
Nov 24, 2015
Sold by
American Properties Land Trust
Bought by
Clark F N
Purchase Details
Closed on
Oct 18, 2011
Sold by
Home Dreams Capital Llc
Bought by
American Properties Land Trust
Purchase Details
Closed on
Oct 30, 2008
Sold by
Fifth Third Mortgage Company
Bought by
Home Dreams Capital Llc
Purchase Details
Closed on
Jul 17, 2007
Sold by
Las Nickel Co Ltd
Bought by
Fifth Third Mortgage Co
Purchase Details
Closed on
Jan 29, 1992
Purchase Details
Closed on
Apr 2, 1990
Create a Home Valuation Report for This Property
The Home Valuation Report is an in-depth analysis detailing your home's value as well as a comparison with similar homes in the area
Home Values in the Area
Average Home Value in this Area
Purchase History
| Date | Buyer | Sale Price | Title Company |
|---|---|---|---|
| City Of Columbus | -- | None Available | |
| Central Ohio Commounity Improvement Corp | -- | None Available | |
| Clark F N | $3,000 | None Available | |
| American Properties Land Trust | $2,500 | None Available | |
| Home Dreams Capital Llc | $3,500 | None Available | |
| Fifth Third Mortgage Co | $20,000 | Prism Titl | |
| -- | -- | -- | |
| -- | $33,000 | -- |
Source: Public Records
Tax History Compared to Growth
Tax History
| Year | Tax Paid | Tax Assessment Tax Assessment Total Assessment is a certain percentage of the fair market value that is determined by local assessors to be the total taxable value of land and additions on the property. | Land | Improvement |
|---|---|---|---|---|
| 2024 | -- | $2,560 | $2,560 | -- |
| 2023 | $0 | $2,555 | $2,555 | $0 |
| 2022 | $0 | $2,280 | $2,280 | $0 |
| 2021 | $0 | $6,160 | $6,160 | $0 |
| 2020 | $0 | $6,160 | $6,160 | $0 |
| 2019 | $468 | $5,320 | $5,320 | $0 |
| 2018 | $468 | $5,320 | $5,320 | $0 |
| 2017 | $580 | $10,850 | $5,320 | $5,530 |
| 2016 | $3,070 | $10,510 | $5,360 | $5,150 |
| 2015 | $937 | $10,510 | $5,360 | $5,150 |
| 2014 | $849 | $10,510 | $5,360 | $5,150 |
| 2013 | $707 | $10,500 | $5,355 | $5,145 |
Source: Public Records
Map
Nearby Homes
- 2397 Sullivant Ave
- 426 S Eureka Ave
- 337 S Wayne Ave
- 349 S Eureka Ave
- 471 S Terrace Ave Unit 473
- 558 S Oakley Ave Unit 60
- 327-329 S Wayne Ave
- 321 S Oakley Ave
- 2263 Shelton St
- 2264 Shelton St
- 545-547 S Highland Ave Unit 545
- 307 S Wheatland Ave
- 540 S Richardson Ave
- 353 Clarendon Ave
- 304 S Highland Ave
- 397 S Burgess Ave
- 405 S Burgess Ave
- 379 Midland Ave
- 274 S Richardson Ave
- 651 S Terrace Ave
- 2400 Sullivant Ave
- 2400-2402 Sullivant Ave
- 2406 Sullivant Ave
- 2394 Sullivant Ave
- 2410 Sullivant Ave
- 2390 Sullivant Ave
- 2414 Sullivant Ave
- 2384 Sullivant Ave
- 455 S Oakley Ave
- 457 S Oakley Ave
- 456 S Wayne Ave Unit 458
- 2424 Sullivant Ave
- 451 S Oakley Ave
- 450 S Wayne Ave
- 2401 Sullivant Ave
- 2393 Sullivant Ave
- 443 S Oakley Ave
- 2405 Sullivant Ave
- 440 S Wayne Ave
- 0 S Wayne Ave