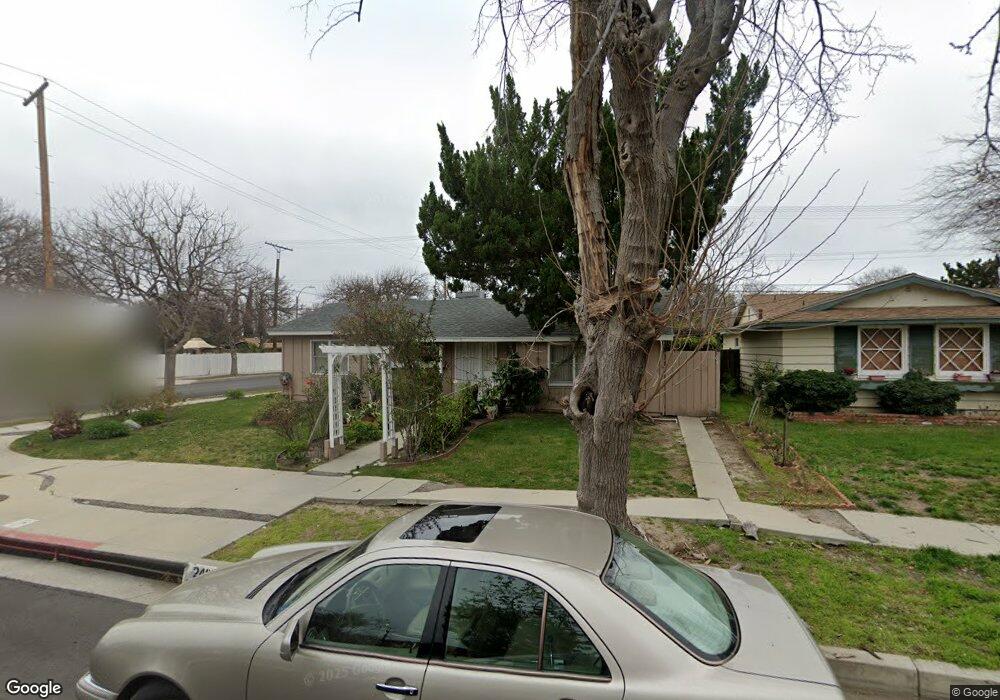
24000 Gilmore St West Hills, CA 91307
Estimated Value: $745,000 - $1,241,000
4
Beds
4
Baths
2,085
Sq Ft
$471/Sq Ft
Est. Value
About This Home
This home is located at 24000 Gilmore St, West Hills, CA 91307 and is currently estimated at $982,387, approximately $471 per square foot. 24000 Gilmore St is a home located in Los Angeles County with nearby schools including Haynes Charter For Enriched Studies, Lockhurst Drive Charter Elementary, and Woodlake Elementary Community Charter.
Ownership History
Date
Name
Owned For
Owner Type
Purchase Details
Closed on
Nov 10, 1998
Sold by
Shirazi Hossein
Bought by
Shirazi Mahnaz
Current Estimated Value
Purchase Details
Closed on
Aug 20, 1998
Sold by
Shirazi Mahnaz
Bought by
Shirazi Hossein
Home Financials for this Owner
Home Financials are based on the most recent Mortgage that was taken out on this home.
Original Mortgage
$128,000
Interest Rate
6.91%
Mortgage Type
Purchase Money Mortgage
Purchase Details
Closed on
Dec 1, 1997
Sold by
Shirazi Hossien
Bought by
Shirazi Hossein and Shirazi Mahnaz
Purchase Details
Closed on
Aug 19, 1997
Sold by
Elliott Mike J
Bought by
Shirazi Hossein
Home Financials for this Owner
Home Financials are based on the most recent Mortgage that was taken out on this home.
Original Mortgage
$135,000
Interest Rate
7.42%
Mortgage Type
Purchase Money Mortgage
Create a Home Valuation Report for This Property
The Home Valuation Report is an in-depth analysis detailing your home's value as well as a comparison with similar homes in the area
Home Values in the Area
Average Home Value in this Area
Purchase History
| Date | Buyer | Sale Price | Title Company |
|---|---|---|---|
| Shirazi Mahnaz | -- | -- | |
| Shirazi Hossein | -- | Fidelity Title | |
| Shirazi Hossein | -- | -- | |
| Shirazi Hossein | $150,000 | -- |
Source: Public Records
Mortgage History
| Date | Status | Borrower | Loan Amount |
|---|---|---|---|
| Previous Owner | Shirazi Hossein | $128,000 | |
| Previous Owner | Shirazi Hossein | $135,000 |
Source: Public Records
Tax History Compared to Growth
Tax History
| Year | Tax Paid | Tax Assessment Tax Assessment Total Assessment is a certain percentage of the fair market value that is determined by local assessors to be the total taxable value of land and additions on the property. | Land | Improvement |
|---|---|---|---|---|
| 2025 | $5,028 | $398,791 | $205,355 | $193,436 |
| 2024 | $5,028 | $390,973 | $201,329 | $189,644 |
| 2023 | $4,935 | $383,308 | $197,382 | $185,926 |
| 2022 | $4,713 | $375,793 | $193,512 | $182,281 |
| 2021 | $4,646 | $368,425 | $189,718 | $178,707 |
| 2019 | $4,218 | $333,480 | $184,092 | $149,388 |
| 2018 | $4,126 | $326,942 | $180,483 | $146,459 |
| 2016 | $3,926 | $314,249 | $173,476 | $140,773 |
| 2015 | $3,870 | $309,530 | $170,871 | $138,659 |
| 2014 | $3,888 | $303,467 | $167,524 | $135,943 |
Source: Public Records
Map
Nearby Homes
- 24101 Mobile St
- 23921 Hamlin St
- 24017 Sylvan St
- 24208 Gilmore St
- 6153 Debs Ave
- 6236 Kenwater Ave
- 23701 Sylvan St
- 24244 Friar St
- 23928 Archwood St
- 23931 Bessemer St
- 6022 Elba Place
- 23549 Victory Blvd Unit 21
- 23920 Vanowen St
- 24221 Aetna St
- 6009 Neddy Ave
- 24415 Lemay St
- 24224 Welby Way
- 6172 Dalecrest Ave
- 5929 Adler Ave
- 5931 Neddy Ave
- 24008 Gilmore St
- 23948 Gilmore St
- 24014 Gilmore St
- 24001 Victory Blvd
- 24009 Victory Blvd
- 24001 Gilmore St
- 23949 Victory Blvd
- 24015 Victory Blvd
- 23942 Gilmore St
- 24020 Gilmore St
- 24009 Gilmore St
- 24015 Gilmore St
- 23951 Gilmore St
- 23943 Victory Blvd
- 24021 Victory Blvd
- 24002 Gilmore St
- 23936 Gilmore St
- 24026 Gilmore St
- 24021 Gilmore St
- 23945 Gilmore St