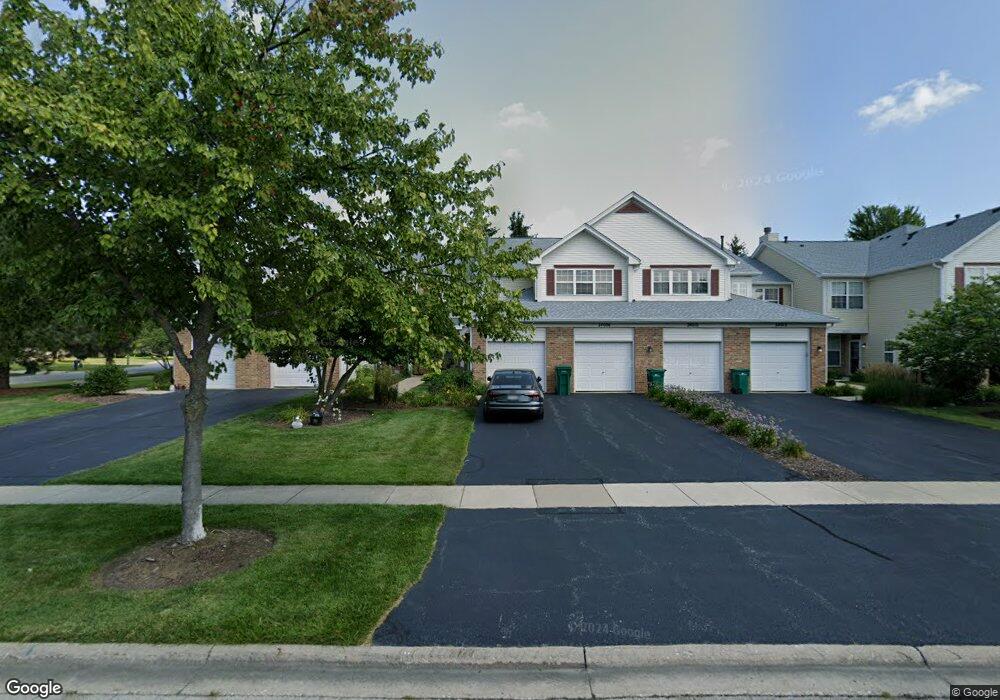
24008 Pear Tree Cir Unit 172204 Plainfield, IL 60585
North Plainfield NeighborhoodEstimated Value: $266,000 - $297,000
2
Beds
2
Baths
1,518
Sq Ft
$186/Sq Ft
Est. Value
About This Home
This home is located at 24008 Pear Tree Cir Unit 172204, Plainfield, IL 60585 and is currently estimated at $282,977, approximately $186 per square foot. 24008 Pear Tree Cir Unit 172204 is a home located in Will County with nearby schools including Eagle Pointe Elementary School, Wentworth Intermediate School, and Heritage Grove Middle School.
Ownership History
Date
Name
Owned For
Owner Type
Purchase Details
Closed on
Apr 26, 2004
Sold by
Rogers Richard S and Rogers Christi A
Bought by
Iskrenov Malin
Current Estimated Value
Home Financials for this Owner
Home Financials are based on the most recent Mortgage that was taken out on this home.
Original Mortgage
$121,600
Outstanding Balance
$49,409
Interest Rate
3.62%
Mortgage Type
New Conventional
Estimated Equity
$233,568
Purchase Details
Closed on
Nov 1, 1996
Sold by
St Paul Trust Company
Bought by
Rogers Richard S and Dixon Christi A
Home Financials for this Owner
Home Financials are based on the most recent Mortgage that was taken out on this home.
Original Mortgage
$109,988
Interest Rate
10.25%
Create a Home Valuation Report for This Property
The Home Valuation Report is an in-depth analysis detailing your home's value as well as a comparison with similar homes in the area
Home Values in the Area
Average Home Value in this Area
Purchase History
| Date | Buyer | Sale Price | Title Company |
|---|---|---|---|
| Iskrenov Malin | $152,000 | Ticor Title Insurance Compan | |
| Rogers Richard S | $137,500 | Chicago Title Insurance Co |
Source: Public Records
Mortgage History
| Date | Status | Borrower | Loan Amount |
|---|---|---|---|
| Open | Iskrenov Malin | $121,600 | |
| Previous Owner | Rogers Richard S | $109,988 | |
| Closed | Iskrenov Malin | $22,800 |
Source: Public Records
Tax History Compared to Growth
Tax History
| Year | Tax Paid | Tax Assessment Tax Assessment Total Assessment is a certain percentage of the fair market value that is determined by local assessors to be the total taxable value of land and additions on the property. | Land | Improvement |
|---|---|---|---|---|
| 2024 | $5,134 | $78,542 | $17,792 | $60,750 |
| 2023 | $5,134 | $69,383 | $15,717 | $53,666 |
| 2022 | $4,221 | $58,667 | $14,868 | $43,799 |
| 2021 | $4,052 | $55,873 | $14,160 | $41,713 |
| 2020 | $4,044 | $54,988 | $13,936 | $41,052 |
| 2019 | $3,975 | $53,438 | $13,543 | $39,895 |
| 2018 | $4,069 | $53,586 | $13,246 | $40,340 |
| 2017 | $4,041 | $52,203 | $12,904 | $39,299 |
| 2016 | $4,044 | $51,079 | $12,626 | $38,453 |
| 2015 | $4,434 | $49,114 | $12,140 | $36,974 |
| 2014 | $4,434 | $53,618 | $12,140 | $41,478 |
| 2013 | $4,434 | $53,618 | $12,140 | $41,478 |
Source: Public Records
Map
Nearby Homes
- 24181 Pear Tree Cir Unit 171206
- 24115 Pear Tree Cir Unit 170807
- 24328 Whispering Trails Dr
- 12929 S Platte Trail
- 23236 W Teton Ln
- 12906 S Slate Ln
- 24333 Leski Ln
- 11723 Heritage Meadows Dr
- 2711 Lawlor Ln
- 2668 Lawlor Ln
- 2739 Lawlor Ln
- 5943 Polo St
- 5907 Polo St
- 5919 Polo St
- 5911 Polo St
- 2611 Lawlor Ln
- 2547 Tailshot Rd
- 2607 Lawlor Ln
- 24436 W Alexis Ln
- 2547 Mallet Ct
- 24010 Pear Tree Cir
- 24004 Pear Tree Cir Unit 172202
- 24014 Pear Tree Cir Unit 172207
- 24012 Pear Tree Cir Unit 172206
- 24006 Pear Tree Cir Unit 172203
- 24006 Pear Tree Cir Unit 23006
- 24002 W Pear Tree Cir Unit 172201
- 24016 W Pear Tree Cir
- 24016 W Pear Tree Cir
- 24178 Pear Tree Cir Unit 171302
- 24190 Pear Tree Cir Unit 171308
- 24188 Pear Tree Cir Unit 171307
- 24182 Pear Tree Cir Unit 171304
- 24180 Pear Tree Cir Unit 171303
- 24186 Pear Tree Cir
- 24184 Pear Tree Cir
- 24182 Pear Tree Cir Unit 1
- 24176 Pear Tree Cir Unit 171301
- 24011 Pear Tree Cir Unit 170103
- 24001 Pear Tree Cir Unit 170108