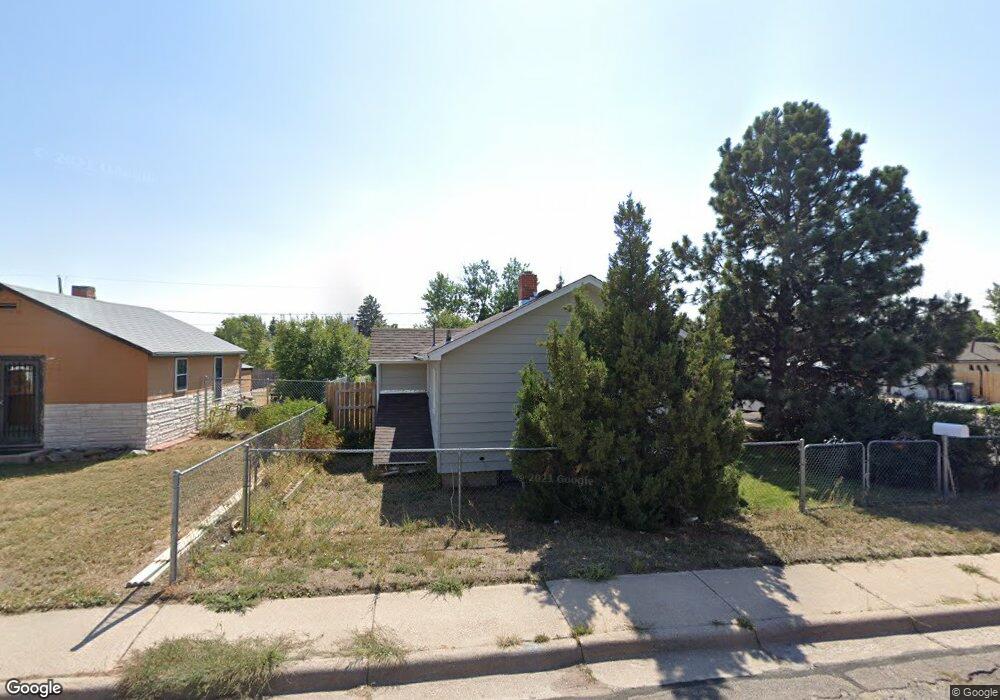
2401 E 12th St Cheyenne, WY 82001
Lake Minnehaha NeighborhoodEstimated Value: $218,000 - $264,000
Studio
--
Bath
400
Sq Ft
$594/Sq Ft
Est. Value
About This Home
This home is located at 2401 E 12th St, Cheyenne, WY 82001 and is currently estimated at $237,736, approximately $594 per square foot. 2401 E 12th St is a home located in Laramie County with nearby schools including Lebhart Elementary School, Fairview Elementary School, and Johnson Junior High School.
Ownership History
Date
Name
Owned For
Owner Type
Purchase Details
Closed on
Sep 17, 2018
Sold by
Grider Timothy R and I T G Investment Llc
Bought by
Stedman Mary A
Current Estimated Value
Purchase Details
Closed on
Jun 12, 2018
Sold by
Grider Timothy R
Bought by
Tg Investments Llc
Home Financials for this Owner
Home Financials are based on the most recent Mortgage that was taken out on this home.
Original Mortgage
$43,000
Interest Rate
4.5%
Mortgage Type
New Conventional
Purchase Details
Closed on
Feb 26, 2018
Sold by
Stonum Teresa L and Stonum James A
Bought by
Tg Investments Llc
Home Financials for this Owner
Home Financials are based on the most recent Mortgage that was taken out on this home.
Original Mortgage
$40,000
Interest Rate
4.04%
Mortgage Type
Commercial
Purchase Details
Closed on
Sep 29, 1998
Sold by
Beatty James A
Bought by
Beatty James A and James A Beatty Living Trust
Create a Home Valuation Report for This Property
The Home Valuation Report is an in-depth analysis detailing your home's value as well as a comparison with similar homes in the area
Home Values in the Area
Average Home Value in this Area
Purchase History
| Date | Buyer | Sale Price | Title Company |
|---|---|---|---|
| Stedman Mary A | $96,000 | None Available | |
| Tg Investments Llc | -- | First American Title | |
| Grider Timothy R | -- | First American Title | |
| Tg Investments Llc | -- | First American Title | |
| Beatty James A | -- | -- |
Source: Public Records
Mortgage History
| Date | Status | Borrower | Loan Amount |
|---|---|---|---|
| Previous Owner | Grider Timothy R | $43,000 | |
| Previous Owner | Tg Investments Llc | $40,000 |
Source: Public Records
Tax History
| Year | Tax Paid | Tax Assessment Tax Assessment Total Assessment is a certain percentage of the fair market value that is determined by local assessors to be the total taxable value of land and additions on the property. | Land | Improvement |
|---|---|---|---|---|
| 2025 | $1,043 | $11,663 | $3,489 | $8,174 |
| 2024 | $1,043 | $14,755 | $4,652 | $10,103 |
| 2023 | $1,023 | $14,473 | $4,652 | $9,821 |
| 2022 | $963 | $13,339 | $4,652 | $8,687 |
| 2021 | $859 | $11,871 | $4,652 | $7,219 |
| 2020 | $827 | $11,459 | $4,652 | $6,807 |
| 2019 | $784 | $10,865 | $4,652 | $6,213 |
| 2018 | $715 | $10,000 | $4,007 | $5,993 |
| 2017 | $428 | $8,933 | $2,962 | $5,971 |
| 2016 | $369 | $8,114 | $2,764 | $5,350 |
| 2015 | $341 | $7,719 | $2,764 | $4,955 |
| 2014 | $322 | $7,427 | $2,764 | $4,663 |
Source: Public Records
Map
Nearby Homes
- 2415 E 10th St
- 2119 E 11th St
- 2107 E 12th St
- 2532 E 9th St
- 2314 E 15th St
- 3849 E Lincolnway
- 1410 Carbon Ave Unit A-D
- 2621 E 10th St
- 1517 Fremont Ave
- 1518 Hot Springs Ave
- 2709 E 9th St
- 2123 E 18th St
- 2008 E 17th St
- 1911 E 17th St
- 1605 E 16th St
- 1841 Crook Ave
- 2111 Garrett St
- 1823 Lilac Ct
- 1103 Cactus Hill Rd
- TBD Charles St
- 2405 E 12th St
- 2411 E 12th St
- 2325 E 12th St
- 2400 E 11th St
- 2415 E 12th St
- 2406 E 11th St
- 1201 Crook Ave
- 2321 E 12th St
- 1203 Crook Ave
- 2322 E 11th St
- 1205 Crook Ave
- 2404 E 12th St
- 2419 E 12th St
- 2408 E 12th St Unit 4
- 2408 E 12th St
- 2315 E 12th St
- 2318 E 11th St
- 1208 Crook Ave
- 2412 E 12th St
- 2423 E 12th St
Your Personal Tour Guide
Ask me questions while you tour the home.