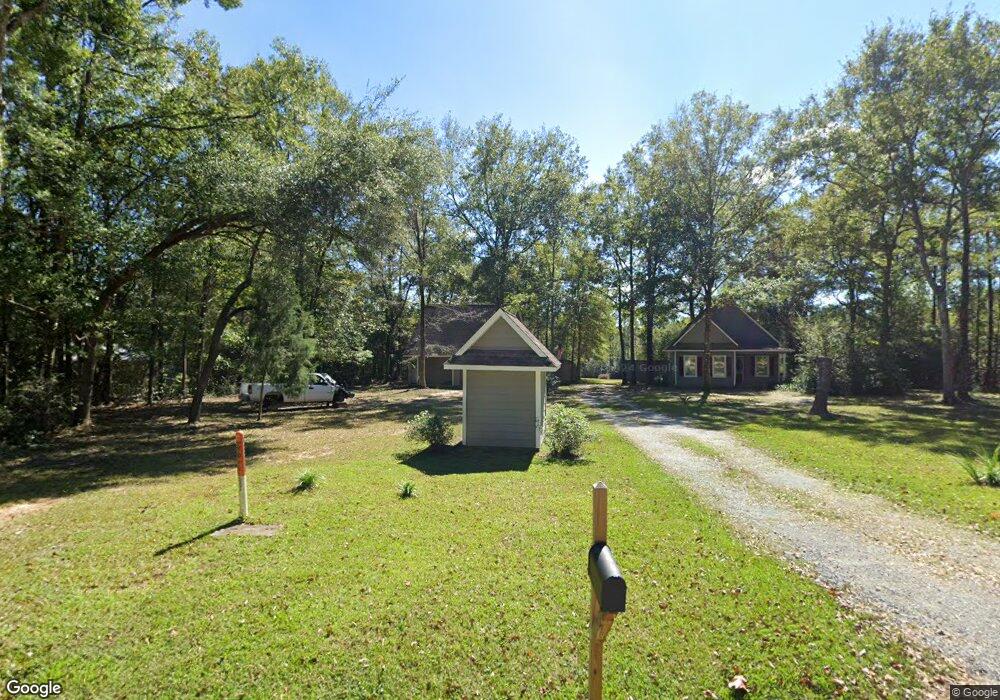
2401 Montcliff Dr Vancleave, MS 39565
Estimated Value: $175,950 - $351,000
Studio
2
Baths
1,048
Sq Ft
$260/Sq Ft
Est. Value
About This Home
This home is located at 2401 Montcliff Dr, Vancleave, MS 39565 and is currently estimated at $272,983, approximately $260 per square foot. 2401 Montcliff Dr is a home located in Jackson County with nearby schools including Vancleave Upper Elementary School, Vancleave Lower Elementary School, and Vancleave Middle School.
Ownership History
Date
Name
Owned For
Owner Type
Purchase Details
Closed on
May 7, 2025
Sold by
Roberts Tracy Michelle and Roberts Kenneth Lee
Bought by
Roberts Terri L and Robbins Tracy Michelle
Current Estimated Value
Purchase Details
Closed on
Oct 2, 2023
Sold by
Roberts Kenneth Lee
Bought by
Roberts Kenneth Lee and Roberts Terri L
Purchase Details
Closed on
Aug 31, 2023
Sold by
Roberts Kenneth Lee
Bought by
Roberts Kenneth Lee and Roberts Tracy Michelle
Create a Home Valuation Report for This Property
The Home Valuation Report is an in-depth analysis detailing your home's value as well as a comparison with similar homes in the area
Home Values in the Area
Average Home Value in this Area
Purchase History
| Date | Buyer | Sale Price | Title Company |
|---|---|---|---|
| Roberts Terri L | -- | Pilger Title | |
| Roberts Terri L | -- | Pilger Title | |
| Roberts Kenneth Lee | -- | Pilger Title | |
| Roberts Kenneth Lee | -- | Pilger Title | |
| Roberts Kenneth Lee | -- | Pilger Title | |
| Roberts Kenneth Lee | -- | Pilger Title |
Source: Public Records
Tax History
| Year | Tax Paid | Tax Assessment Tax Assessment Total Assessment is a certain percentage of the fair market value that is determined by local assessors to be the total taxable value of land and additions on the property. | Land | Improvement |
|---|---|---|---|---|
| 2025 | $1,005 | $12,835 | $4,175 | $8,660 |
| 2024 | $1,005 | $10,961 | $4,069 | $6,892 |
| 2023 | $1,016 | $10,961 | $4,069 | $6,892 |
| 2022 | $978 | $10,961 | $4,069 | $6,892 |
| 2021 | $1,009 | $11,228 | $4,069 | $7,159 |
| 2020 | $962 | $10,451 | $3,430 | $7,021 |
| 2019 | $949 | $10,451 | $3,430 | $7,021 |
| 2018 | $973 | $10,451 | $3,430 | $7,021 |
| 2017 | $995 | $10,451 | $3,430 | $7,021 |
| 2016 | $943 | $10,451 | $3,430 | $7,021 |
| 2015 | $805 | $92,420 | $32,220 | $60,200 |
| 2014 | $807 | $9,422 | $3,222 | $6,200 |
| 2013 | $1,088 | $9,582 | $3,222 | $6,360 |
Source: Public Records
Map
Nearby Homes
- 15208 Old River Rd
- 2804 Holden Dr
- 2913 Holden Dr
- 3112 Holden Dr
- 2111 Holder Rd
- 2513 Krystal Ln
- 2200 Inabinette Rd
- 1903 Goldrush St
- 2212 Sampras Blvd
- 2337 Connors Blvd
- Lot 111 River Place
- 0 Dr Unit 4052148
- 1920 Van Dr
- 0 River Bluffs Lot 33 Dr
- 0 Paige Bayou Rd
- None Mississippi 57
- 17220 Old Kelly Rd
- 0 Fairley Rd
- 4716 Ashmore Ridge
- 16621 Sierra Ln
- 2385 Montcliff Dr
- 2408 Montcliff Dr
- 000 Montcliff Dr
- 2490 Montcliff Dr
- 2501 Montcliff Dr
- 2306 Montcliff Dr
- Nhn Montcliff Dr
- 14708 Old River Rd
- None Montcliff Dr
- 2300 Montcliff Dr
- 14420 Mount Pleasant Rd
- 2305 Montcliff Dr
- 2312 Montcliff Dr
- 14800 Old River Rd
- 14700 Old River Rd
- 14512 Mount Pleasant Rd
- 14720 Old River Rd
- 14350 Mount Pleasant Rd
- 14900 Old River Rd
- 14724 Old River Rd
Your Personal Tour Guide
Ask me questions while you tour the home.