
Landlord's Agent in 2025
Oriana Wyche
Skye Unlimited Management and Real Estate LLC
(404) 374-4973
25 Total Sales
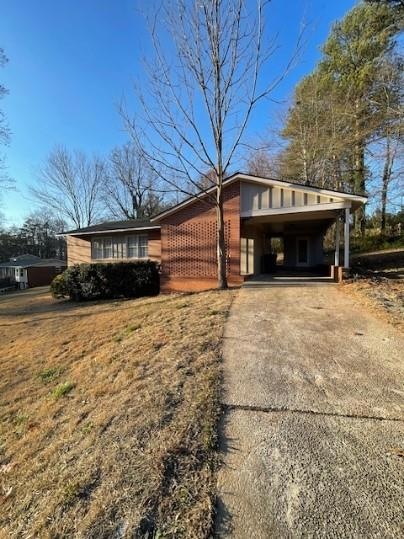
Estimated Value: $179,000 - $266,000
This home is located at 2401 Neal Ct SW, Marietta, GA 30008 since 04 February 2025 and is currently priced at $241,268. This property was built in 1960. 2401 Neal Ct SW is a home located in Cobb County with nearby schools including Milford Elementary School, Smitha Middle School, and Osborne High School.
Last Agent to Rent the Property
Skye Unlimited Management and Real Estate LLC License #297178 Listed on: 02/04/2025
Last Renter's Agent
NON-MLS NMLS
Non FMLS Member
| Date | Event | Price | List to Sale | Price per Sq Ft |
|---|---|---|---|---|
| 02/12/2025 02/12/25 | Rented | $1,750 | 0.0% | -- |
| 02/04/2025 02/04/25 | For Rent | $1,750 | -- | -- |
| Year | Tax Paid | Tax Assessment Tax Assessment Total Assessment is a certain percentage of the fair market value that is determined by local assessors to be the total taxable value of land and additions on the property. | Land | Improvement |
|---|---|---|---|---|
| 2025 | $2,814 | $93,388 | $44,000 | $49,388 |
| 2024 | $2,816 | $93,388 | $44,000 | $49,388 |
| 2023 | $2,354 | $78,084 | $20,000 | $58,084 |
| 2022 | $2,370 | $78,084 | $20,000 | $58,084 |
| 2021 | $1,514 | $49,876 | $20,000 | $29,876 |
| 2020 | $1,514 | $49,876 | $20,000 | $29,876 |
| 2019 | $1,229 | $40,488 | $16,000 | $24,488 |
| 2018 | $1,229 | $40,488 | $16,000 | $24,488 |
| 2017 | $967 | $33,640 | $6,000 | $27,640 |
| 2016 | $967 | $33,640 | $6,000 | $27,640 |
| 2015 | $476 | $16,160 | $6,000 | $10,160 |
| 2014 | $480 | $16,160 | $0 | $0 |
Landlord's Agent in 2025
Oriana Wyche
Skye Unlimited Management and Real Estate LLC
(404) 374-4973
25 Total Sales
N
Tenant's Agent in 2025
NON-MLS NMLS
Non FMLS Member
Source: First Multiple Listing Service (FMLS)
MLS Number: 7519480
APN: 19-0555-0-017-0
Disclaimer: Certain information contained herein is derived from information provided by parties other than Homes.com. All information provided is deemed reliable, but is not guaranteed to be accurate and should be independently verified.
![]() Listings identified with the FMLS IDX logo come from FMLS and are held by brokerage firms other than the owner of this website. The listing brokerage is identified in any listing details. Information is deemed reliable but is not guaranteed. If you believe any FMLS listing contains material that infringes your copyrighted work please visit www.fmls.com/dmca to review our DMCA policy and learn how to submit a takedown request. © 2025 First Multiple Listing Service, Inc.
Listings identified with the FMLS IDX logo come from FMLS and are held by brokerage firms other than the owner of this website. The listing brokerage is identified in any listing details. Information is deemed reliable but is not guaranteed. If you believe any FMLS listing contains material that infringes your copyrighted work please visit www.fmls.com/dmca to review our DMCA policy and learn how to submit a takedown request. © 2025 First Multiple Listing Service, Inc.