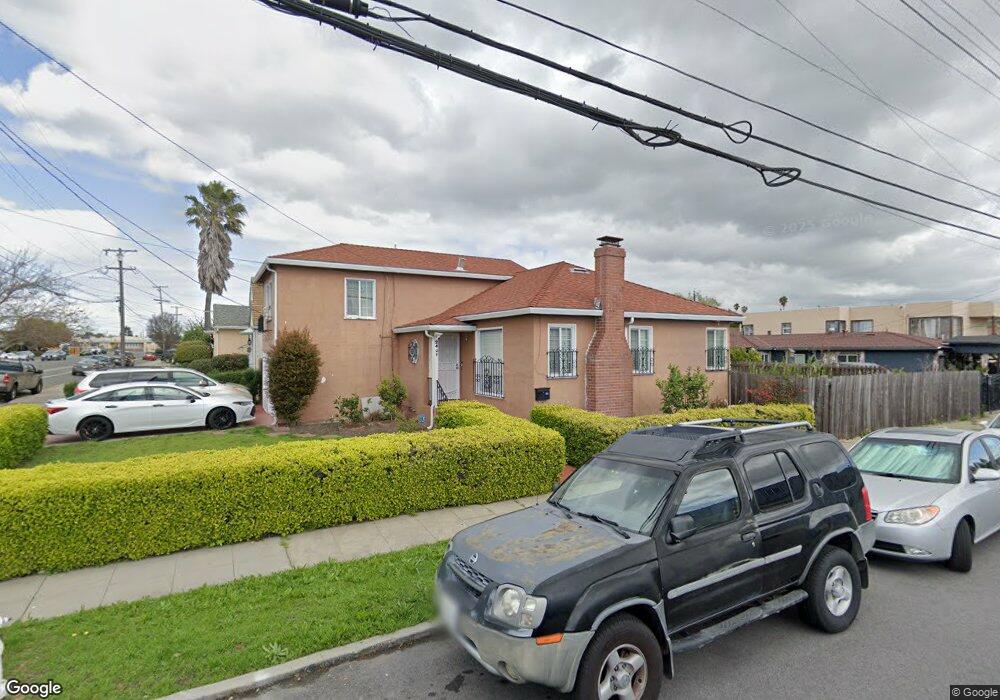
2401 Roosevelt Ave Richmond, CA 94804
North & East NeighborhoodEstimated Value: $576,527 - $735,000
3
Beds
2
Baths
1,426
Sq Ft
$463/Sq Ft
Est. Value
About This Home
This home is located at 2401 Roosevelt Ave, Richmond, CA 94804 and is currently estimated at $659,632, approximately $462 per square foot. 2401 Roosevelt Ave is a home located in Contra Costa County with nearby schools including Michelle Obama School, Lovonya DeJean Middle School, and John F. Kennedy High School.
Ownership History
Date
Name
Owned For
Owner Type
Purchase Details
Closed on
Jan 23, 2012
Sold by
Bartling Dennis Gene and Bartling Mary Helen
Bought by
Tu Ponly and Tu Khuong
Current Estimated Value
Home Financials for this Owner
Home Financials are based on the most recent Mortgage that was taken out on this home.
Original Mortgage
$134,400
Outstanding Balance
$91,566
Interest Rate
3.85%
Mortgage Type
New Conventional
Estimated Equity
$568,066
Purchase Details
Closed on
Mar 15, 2006
Sold by
Bartling Mary Helen
Bought by
Bartling Dennis Gene and Bartling Mary Helen
Purchase Details
Closed on
Jun 5, 2002
Sold by
Bartling Mary Helen
Bought by
Gomez Guadalupe and Bartling Mary Helen
Purchase Details
Closed on
Sep 21, 1996
Sold by
Gomez Albert J
Bought by
Albert James Gomes Trust
Create a Home Valuation Report for This Property
The Home Valuation Report is an in-depth analysis detailing your home's value as well as a comparison with similar homes in the area
Home Values in the Area
Average Home Value in this Area
Purchase History
| Date | Buyer | Sale Price | Title Company |
|---|---|---|---|
| Tu Ponly | $168,000 | Old Republic Title Company | |
| Bartling Dennis Gene | -- | None Available | |
| Gomez Guadalupe | -- | -- | |
| Albert James Gomes Trust | -- | -- |
Source: Public Records
Mortgage History
| Date | Status | Borrower | Loan Amount |
|---|---|---|---|
| Open | Tu Ponly | $134,400 |
Source: Public Records
Tax History
| Year | Tax Paid | Tax Assessment Tax Assessment Total Assessment is a certain percentage of the fair market value that is determined by local assessors to be the total taxable value of land and additions on the property. | Land | Improvement |
|---|---|---|---|---|
| 2025 | $4,424 | $211,005 | $144,440 | $66,565 |
| 2024 | $4,299 | $206,868 | $141,608 | $65,260 |
| 2023 | $4,299 | $202,813 | $138,832 | $63,981 |
| 2022 | $4,193 | $198,837 | $136,110 | $62,727 |
| 2021 | $4,119 | $194,940 | $133,442 | $61,498 |
| 2019 | $3,860 | $189,160 | $129,485 | $59,675 |
| 2018 | $3,738 | $185,452 | $126,947 | $58,505 |
| 2017 | $3,717 | $181,816 | $124,458 | $57,358 |
| 2016 | $3,645 | $178,252 | $122,018 | $56,234 |
| 2015 | $3,606 | $175,576 | $120,186 | $55,390 |
| 2014 | $3,576 | $172,137 | $117,832 | $54,305 |
Source: Public Records
Map
Nearby Homes
Your Personal Tour Guide
Ask me questions while you tour the home.