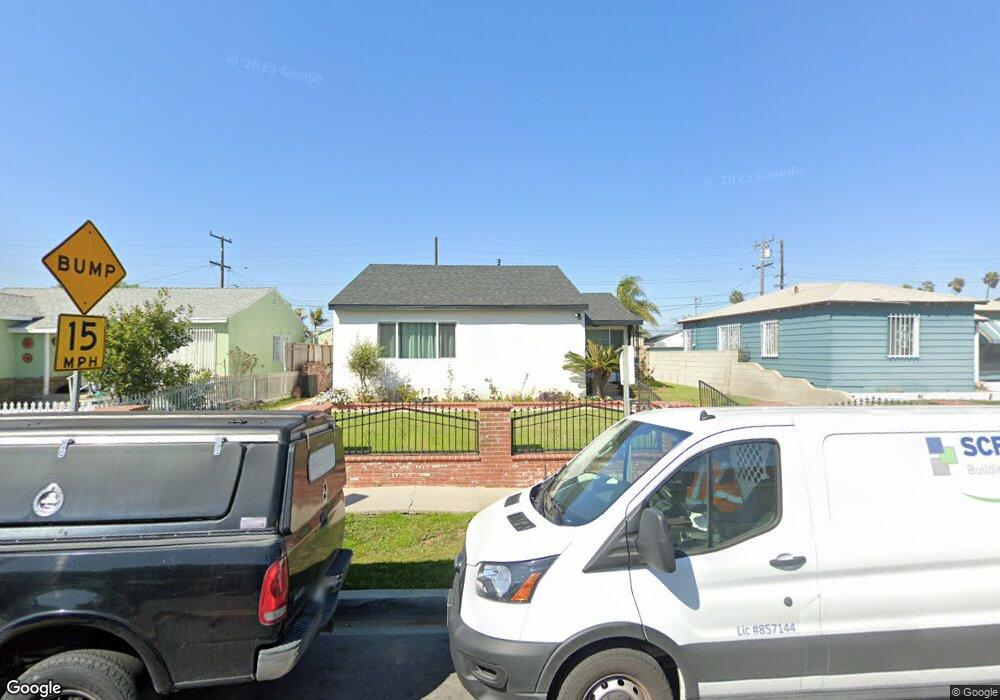
2401 W Corydon St Compton, CA 90220
Estimated Value: $632,000 - $728,000
3
Beds
1
Bath
1,320
Sq Ft
$515/Sq Ft
Est. Value
About This Home
This home is located at 2401 W Corydon St, Compton, CA 90220 and is currently estimated at $679,218, approximately $514 per square foot. 2401 W Corydon St is a home located in Los Angeles County with nearby schools including Bursch Elementary School, Enterprise Middle School, and Compton High School.
Ownership History
Date
Name
Owned For
Owner Type
Purchase Details
Closed on
Jun 18, 2009
Sold by
Garner Stanley
Bought by
Ledesma Miguel
Current Estimated Value
Home Financials for this Owner
Home Financials are based on the most recent Mortgage that was taken out on this home.
Original Mortgage
$232,707
Interest Rate
5.25%
Mortgage Type
FHA
Purchase Details
Closed on
Dec 28, 2007
Sold by
Garner Doretha
Bought by
Garner Stanley
Home Financials for this Owner
Home Financials are based on the most recent Mortgage that was taken out on this home.
Original Mortgage
$165,000
Interest Rate
6.05%
Mortgage Type
Balloon
Purchase Details
Closed on
Oct 18, 2004
Sold by
Garner Myrtis J
Bought by
Garner Myrtis J and The Myrtis J Garner Living Trust
Create a Home Valuation Report for This Property
The Home Valuation Report is an in-depth analysis detailing your home's value as well as a comparison with similar homes in the area
Home Values in the Area
Average Home Value in this Area
Purchase History
| Date | Buyer | Sale Price | Title Company |
|---|---|---|---|
| Ledesma Miguel | $237,000 | Fatcola | |
| Garner Stanley | -- | Chicago Title Company | |
| Garner Stanley | -- | Chicago Title Company | |
| Garner Myrtis J | -- | -- |
Source: Public Records
Mortgage History
| Date | Status | Borrower | Loan Amount |
|---|---|---|---|
| Previous Owner | Ledesma Miguel | $232,707 | |
| Previous Owner | Garner Stanley | $165,000 |
Source: Public Records
Tax History
| Year | Tax Paid | Tax Assessment Tax Assessment Total Assessment is a certain percentage of the fair market value that is determined by local assessors to be the total taxable value of land and additions on the property. | Land | Improvement |
|---|---|---|---|---|
| 2025 | $5,809 | $305,909 | $215,567 | $90,342 |
| 2024 | $5,809 | $299,912 | $211,341 | $88,571 |
| 2023 | $5,734 | $294,033 | $207,198 | $86,835 |
| 2022 | $5,725 | $288,269 | $203,136 | $85,133 |
| 2021 | $5,138 | $282,617 | $199,153 | $83,464 |
| 2019 | $5,283 | $274,237 | $193,247 | $80,990 |
| 2018 | $5,091 | $268,860 | $189,458 | $79,402 |
| 2016 | $4,821 | $258,422 | $182,102 | $76,320 |
| 2015 | $4,607 | $254,541 | $179,367 | $75,174 |
| 2014 | $4,521 | $249,556 | $175,854 | $73,702 |
Source: Public Records
Map
Nearby Homes
- 1143 E 150th St
- 2215 W 153rd St
- 2202 W 153rd St
- 1033 E 149th St
- 1802 W 153rd St
- 14609 S Cahita Ave
- 1616 W Palmer St
- 14513 S Loness Ave
- 801 E Compton Blvd
- 1512 W 152nd St
- 14502 S Keene Ave
- 1498 W Compton Blvd
- 15520 S Mckinley Ave
- 14433 S Cahita Ave
- 620 S Barclay Ave
- 705 S Corlett Ave
- 1485 W 154th St
- 15712 S Haskins Ave
- 431 S Tajauta Ave
- 2404 W Alondra Blvd
- 2319 W Corydon St
- 2405 W Corydon St
- 2317 W Corydon St
- 2406 W Compton Blvd
- 2400 W Compton Blvd
- 2410 W Compton Blvd
- 2311 W Corydon St
- 2417 W Corydon St
- 2414 W Compton Blvd
- 2310 W Compton Blvd
- 2400 W Corydon St
- 2312 W Corydon St
- 2414 W Corydon St
- 2306 W Compton Blvd
- 2307 W Corydon St
- 2418 W Compton Blvd
- 2308 W Corydon St
- 2300 W Compton Blvd Unit 2300, 2304
- 2300 W Compton Blvd Unit 2
- 2300 W Compton Blvd
Your Personal Tour Guide
Ask me questions while you tour the home.