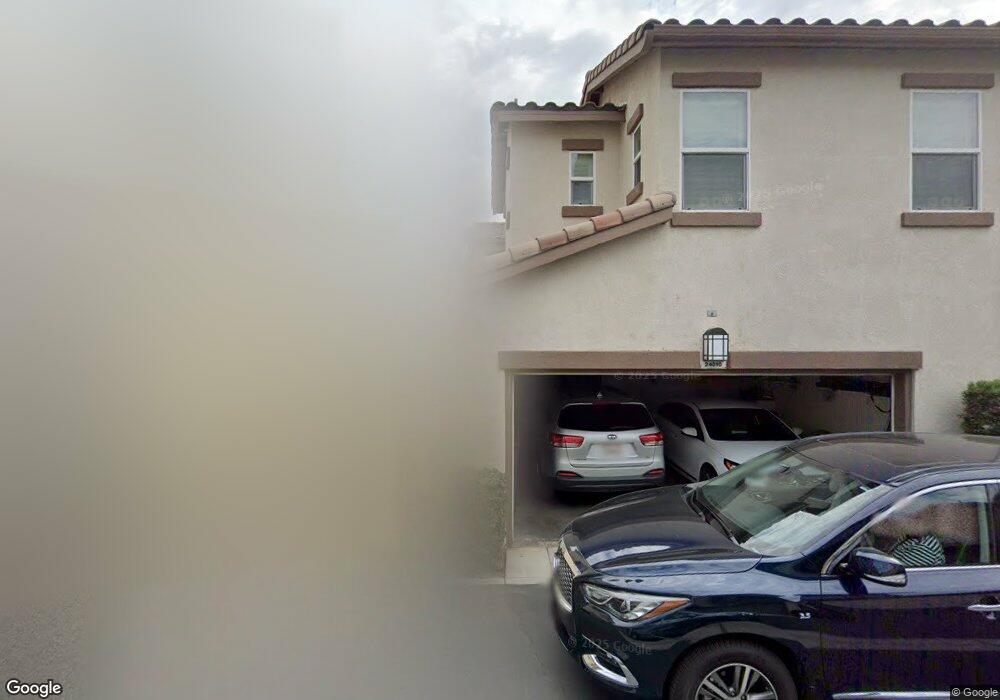
24010 Cornelia Place Unit 73 Valencia, CA 91354
Estimated Value: $712,000 - $760,000
3
Beds
3
Baths
1,761
Sq Ft
$412/Sq Ft
Est. Value
About This Home
This home is located at 24010 Cornelia Place Unit 73, Valencia, CA 91354 and is currently estimated at $725,966, approximately $412 per square foot. 24010 Cornelia Place Unit 73 is a home located in Los Angeles County with nearby schools including Bridgeport Elementary School, Rio Norte Junior High School, and Valencia High School.
Ownership History
Date
Name
Owned For
Owner Type
Purchase Details
Closed on
Oct 19, 2015
Sold by
Kim Jason I
Bought by
Kim Jason I and Kim Angela K
Current Estimated Value
Home Financials for this Owner
Home Financials are based on the most recent Mortgage that was taken out on this home.
Original Mortgage
$393,000
Outstanding Balance
$308,042
Interest Rate
3.85%
Mortgage Type
New Conventional
Estimated Equity
$417,924
Purchase Details
Closed on
Oct 24, 2006
Sold by
Kim Angela K Y
Bought by
Kim Jason I
Home Financials for this Owner
Home Financials are based on the most recent Mortgage that was taken out on this home.
Original Mortgage
$381,000
Interest Rate
6.37%
Mortgage Type
Purchase Money Mortgage
Purchase Details
Closed on
Jan 31, 2005
Sold by
Valencia Ii Associates Llc
Bought by
Kim Jason I and Kim Angela K Y
Home Financials for this Owner
Home Financials are based on the most recent Mortgage that was taken out on this home.
Original Mortgage
$359,650
Interest Rate
1%
Mortgage Type
Purchase Money Mortgage
Create a Home Valuation Report for This Property
The Home Valuation Report is an in-depth analysis detailing your home's value as well as a comparison with similar homes in the area
Home Values in the Area
Average Home Value in this Area
Purchase History
| Date | Buyer | Sale Price | Title Company |
|---|---|---|---|
| Kim Jason I | -- | Fidelity National Title Co | |
| Kim Jason I | -- | Chicago Title Co | |
| Kim Jason I | $454,000 | Fidelity National Title Co |
Source: Public Records
Mortgage History
| Date | Status | Borrower | Loan Amount |
|---|---|---|---|
| Open | Kim Jason I | $393,000 | |
| Closed | Kim Jason I | $381,000 | |
| Closed | Kim Jason I | $359,650 |
Source: Public Records
Tax History
| Year | Tax Paid | Tax Assessment Tax Assessment Total Assessment is a certain percentage of the fair market value that is determined by local assessors to be the total taxable value of land and additions on the property. | Land | Improvement |
|---|---|---|---|---|
| 2025 | $8,386 | $632,819 | $223,018 | $409,801 |
| 2024 | $8,386 | $620,412 | $218,646 | $401,766 |
| 2023 | $8,177 | $608,248 | $214,359 | $393,889 |
| 2022 | $8,239 | $596,322 | $210,156 | $386,166 |
| 2021 | $7,580 | $544,000 | $192,000 | $352,000 |
| 2020 | $7,303 | $521,000 | $184,000 | $337,000 |
| 2019 | $6,961 | $498,000 | $176,000 | $322,000 |
| 2018 | $6,949 | $498,000 | $176,000 | $322,000 |
| 2016 | $6,286 | $453,000 | $160,000 | $293,000 |
| 2015 | $6,146 | $453,000 | $160,000 | $293,000 |
| 2014 | $6,183 | $453,000 | $160,000 | $293,000 |
Source: Public Records
Map
Nearby Homes
- 27386 Dearborn Dr
- 24081 Stone Creek Dr
- 27285 Blue Spruce Place
- 24125 Willowbrooke Ct
- 27637 Olive Mill Ct
- 27448 Bridgewater Dr
- 24328 Calle La Roca
- 24354 Corte Parillada
- 24358 Corte Parillada
- 27903 Baneberry Place Unit 10
- 27038 Edgewater Ln
- 27072 Victoria Ln Unit 126
- 27879 Alta Vista Ave
- 27149 Highlands Ln
- 27955 Trillium Ln Unit 62
- 27052 Island Rd
- 24163 Arrowhead Ct
- 27053 Island Rd
- 28003 Dickason Dr
- 23664 Clearidge Dr
- 24012 Cornelia Place
- 24014 Cornelia Place
- 24006 Cornelia Place Unit 72
- 24006 Cornelia Place
- 24004 Cornelia Place
- 24002 Cornelia Place
- 24011 Cornelia Place
- 24007 Cornelia Place
- 24037 Dearborn Dr
- 24005 Cornelia Place
- 27404 Dearborn Dr
- 27448 Acacia Dr
- 27444 Acacia Dr
- 27406 Dearborn Dr
- 27402 Dearborn Dr
- 24003 Cornelia Place Unit 69
- 24003 Cornelia Place
- 24035 Dearborn Dr
- 27400 Dearborn Dr
- 27408 Dearborn Dr
Your Personal Tour Guide
Ask me questions while you tour the home.