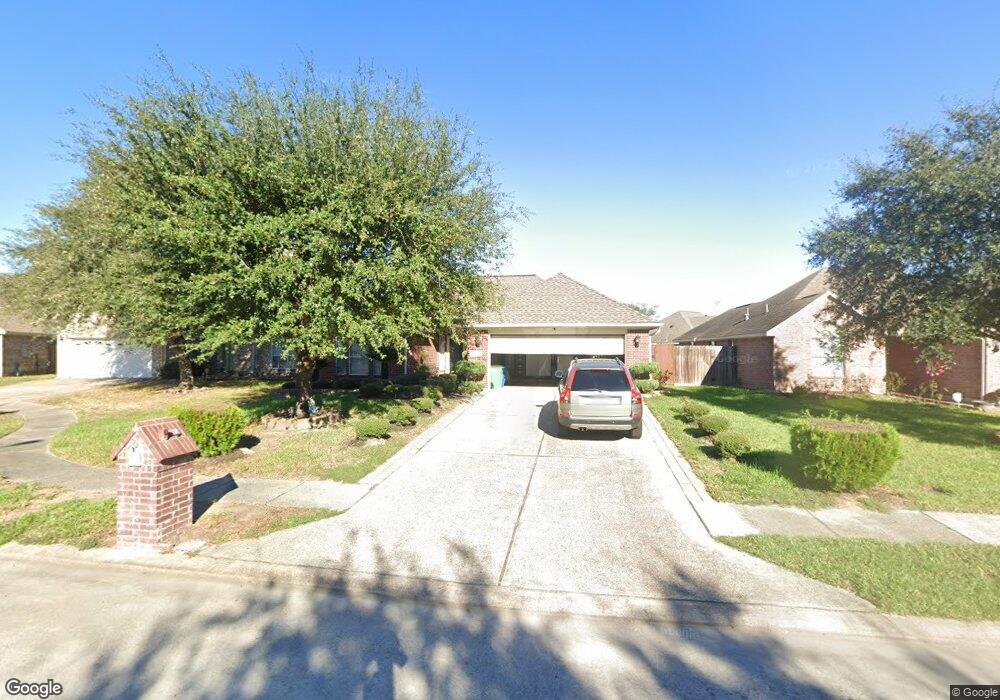
24018 Thistlegate Ct Spring, TX 77373
Estimated Value: $236,000 - $252,219
3
Beds
2
Baths
1,827
Sq Ft
$133/Sq Ft
Est. Value
About This Home
This home is located at 24018 Thistlegate Ct, Spring, TX 77373 and is currently estimated at $242,805, approximately $132 per square foot. 24018 Thistlegate Ct is a home located in Harris County with nearby schools including Chet Burchett Elementary School, Ricky C. Bailey Middle School, and Spring High School.
Ownership History
Date
Name
Owned For
Owner Type
Purchase Details
Closed on
Sep 10, 2007
Sold by
Wells Fargo Bank Na
Bought by
Rodriguez Deysy E and Rodriguez Jose L
Current Estimated Value
Home Financials for this Owner
Home Financials are based on the most recent Mortgage that was taken out on this home.
Original Mortgage
$105,000
Interest Rate
6.43%
Mortgage Type
Purchase Money Mortgage
Purchase Details
Closed on
Apr 3, 2007
Sold by
Nicholas Toliver Lo Keitha R and Toliver Terrance
Bought by
Wells Fargo Bank Na and Asset Backed Pass Through Certificates S
Purchase Details
Closed on
Jul 9, 2004
Sold by
Troy Builders I Lp
Bought by
Nicholas Toliver Lo Keitha R and Toliver Terrance
Home Financials for this Owner
Home Financials are based on the most recent Mortgage that was taken out on this home.
Original Mortgage
$134,900
Interest Rate
6.75%
Mortgage Type
Purchase Money Mortgage
Create a Home Valuation Report for This Property
The Home Valuation Report is an in-depth analysis detailing your home's value as well as a comparison with similar homes in the area
Home Values in the Area
Average Home Value in this Area
Purchase History
| Date | Buyer | Sale Price | Title Company |
|---|---|---|---|
| Rodriguez Deysy E | -- | None Available | |
| Wells Fargo Bank Na | $102,532 | None Available | |
| Nicholas Toliver Lo Keitha R | -- | Texas American Title Company |
Source: Public Records
Mortgage History
| Date | Status | Borrower | Loan Amount |
|---|---|---|---|
| Previous Owner | Rodriguez Deysy E | $105,000 | |
| Previous Owner | Nicholas Toliver Lo Keitha R | $134,900 |
Source: Public Records
Tax History
| Year | Tax Paid | Tax Assessment Tax Assessment Total Assessment is a certain percentage of the fair market value that is determined by local assessors to be the total taxable value of land and additions on the property. | Land | Improvement |
|---|---|---|---|---|
| 2025 | $5,077 | $266,839 | $43,062 | $223,777 |
| 2024 | $5,077 | $271,490 | $43,062 | $228,428 |
| 2023 | $5,077 | $279,675 | $43,062 | $236,613 |
| 2022 | $5,311 | $245,884 | $19,993 | $225,891 |
| 2021 | $5,115 | $199,352 | $19,993 | $179,359 |
| 2020 | $4,966 | $178,387 | $19,993 | $158,394 |
| 2019 | $4,723 | $169,700 | $24,427 | $145,273 |
| 2018 | $3,739 | $152,259 | $24,427 | $127,832 |
| 2017 | $3,859 | $152,259 | $24,427 | $127,832 |
| 2016 | $3,509 | $137,251 | $24,427 | $112,824 |
| 2015 | $2,585 | $137,251 | $24,427 | $112,824 |
| 2014 | $2,585 | $124,717 | $24,427 | $100,290 |
Source: Public Records
Map
Nearby Homes
- 4522 Cannongate Dr
- 24022 Rockygate Dr
- 23815 Firegate Dr
- 23915 Floragate Dr
- 4515 Mossygate Dr
- 4423 Mossygate Dr
- 23303 Brat Pass Dr
- 23123 Gold Run Dr
- 4259 Wyanngate Dr
- 3022 Pathfinders Pass
- 4827 Tealgate Dr
- 22939 Aspen Vista Dr
- 23314 Sawmill Pass
- 4226 Mossygate Dr
- 4911 Tealgate Dr
- 4538 Burkegate Dr
- 4318 Burkegate Dr
- 2518 Kingsford Arbor Way
- 23123 Barrington Bluff Trail
- 4311 Enchantedgate Dr
- 24014 Thistlegate Ct
- 24022 Thistlegate Ct
- 24011 Holleygate Ct
- 24010 Thistlegate Ct
- 24015 Holleygate Ct
- 24026 Thistlegate Ct
- 24007 Holleygate Ct
- 24019 Holleygate Ct
- 24006 Thistlegate Ct
- 24019 Thistlegate Ct
- 24023 Thistlegate Ct
- 24015 Thistlegate Ct
- 24030 Thistlegate Ct
- 24023 Holleygate Ct
- 4435 Cannongate Dr
- 24027 Thistlegate Ct
- 24011 Thistlegate Ct
- 24031 Thistlegate Ct
- 24002 Thistlegate Ct
- 4503 Cannongate Dr
Your Personal Tour Guide
Ask me questions while you tour the home.