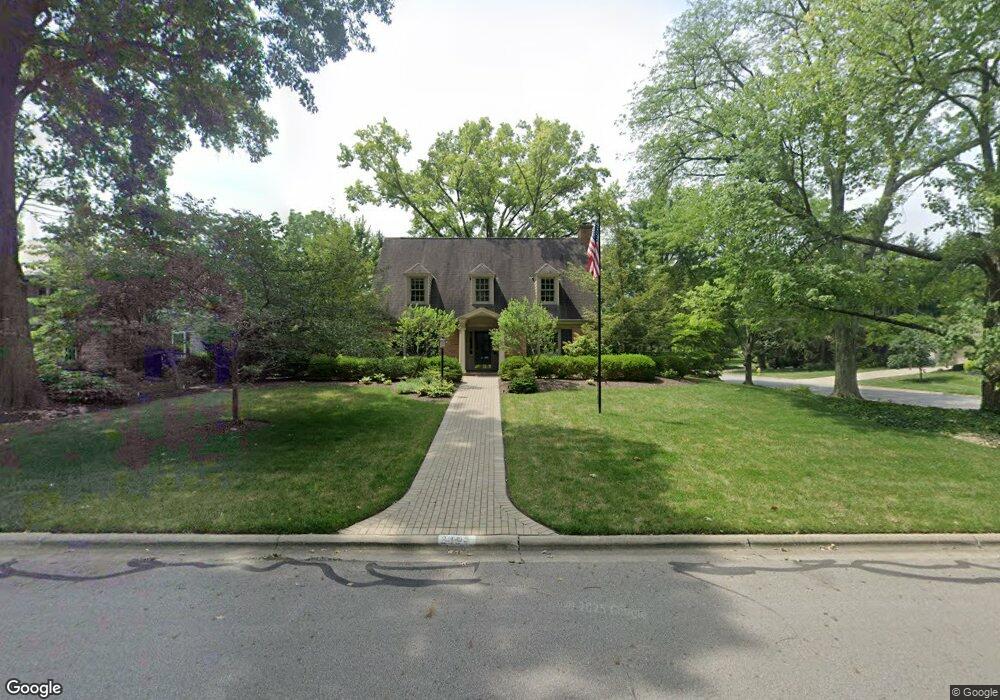
2403 Canterbury Rd Columbus, OH 43221
Estimated Value: $1,026,000 - $1,310,000
3
Beds
4
Baths
3,600
Sq Ft
$322/Sq Ft
Est. Value
About This Home
This home is located at 2403 Canterbury Rd, Columbus, OH 43221 and is currently estimated at $1,160,005, approximately $322 per square foot. 2403 Canterbury Rd is a home located in Franklin County with nearby schools including Tremont Elementary School, Jones Middle School, and Upper Arlington High School.
Ownership History
Date
Name
Owned For
Owner Type
Purchase Details
Closed on
Oct 7, 2025
Sold by
Klayman Gale D
Bought by
Gale D Klayman Trust and Steven M Klayman Trust
Current Estimated Value
Purchase Details
Closed on
Jun 28, 2007
Sold by
Kayne Daniel J
Bought by
Klayman Gale D
Purchase Details
Closed on
Sep 28, 2006
Sold by
Ahrendt David L and Head Ansley D
Bought by
Kayne Daniel J
Purchase Details
Closed on
Dec 13, 2002
Sold by
Carter Neal Edward and Carter Susan Rae
Bought by
Ahrendt David L and Head Ansley D
Home Financials for this Owner
Home Financials are based on the most recent Mortgage that was taken out on this home.
Original Mortgage
$471,200
Interest Rate
5.87%
Purchase Details
Closed on
Aug 31, 1999
Sold by
Bank One Trust Company Na
Bought by
Carter Neal Edward and Carter Susan Rae
Purchase Details
Closed on
May 14, 1998
Sold by
Peterson Jane M
Bought by
Bank One Trust Company Na
Create a Home Valuation Report for This Property
The Home Valuation Report is an in-depth analysis detailing your home's value as well as a comparison with similar homes in the area
Home Values in the Area
Average Home Value in this Area
Purchase History
| Date | Buyer | Sale Price | Title Company |
|---|---|---|---|
| Gale D Klayman Trust | -- | None Listed On Document | |
| Klayman Gale D | -- | None Listed On Document | |
| Klayman Gale D | -- | Amerititle | |
| Kayne Daniel J | $640,000 | Land Sel Ti | |
| Ahrendt David L | $589,000 | -- | |
| Carter Neal Edward | $350,000 | Independent Title | |
| Bank One Trust Company Na | -- | -- |
Source: Public Records
Mortgage History
| Date | Status | Borrower | Loan Amount |
|---|---|---|---|
| Previous Owner | Ahrendt David L | $471,200 | |
| Closed | Ahrendt David L | $117,800 |
Source: Public Records
Tax History Compared to Growth
Tax History
| Year | Tax Paid | Tax Assessment Tax Assessment Total Assessment is a certain percentage of the fair market value that is determined by local assessors to be the total taxable value of land and additions on the property. | Land | Improvement |
|---|---|---|---|---|
| 2024 | $16,250 | $290,500 | $100,170 | $190,330 |
| 2023 | $16,085 | $290,500 | $100,170 | $190,330 |
| 2022 | $15,553 | $231,320 | $63,070 | $168,250 |
| 2021 | $13,768 | $231,320 | $63,070 | $168,250 |
| 2020 | $13,646 | $231,320 | $63,070 | $168,250 |
| 2019 | $12,167 | $184,210 | $63,070 | $121,140 |
| 2018 | $6,049 | $184,210 | $63,070 | $121,140 |
| 2017 | $12,074 | $184,210 | $63,070 | $121,140 |
| 2016 | $14,591 | $229,430 | $53,480 | $175,950 |
| 2015 | $7,289 | $229,430 | $53,480 | $175,950 |
| 2014 | $14,595 | $229,430 | $53,480 | $175,950 |
| 2013 | $6,942 | $208,565 | $48,615 | $159,950 |
Source: Public Records
Map
Nearby Homes
- 2979 Avalon Rd
- 2227 Zollinger Rd
- 3161 Avalon Rd
- 2370 Zollinger Rd
- 3163 S Dorchester Rd
- 2438 Sherwood Villa Unit 5
- 2594 Scioto View Ln Unit 2594
- 2782 Chateau Cir S Unit 45
- 2785 Chateau Cir Unit 69
- 3190 Kioka Ave
- 2583 Wexford Rd
- 2047 Langham Rd
- 2225 Swansea Rd
- 2729 Eastcleft Dr
- 3106 Somerford Rd
- 2063 Westover Rd
- 2827 Katmai Dr
- The Sierra Plan at Quarry Trails - Single Family Homes
- The Aspen Plan at Quarry Trails - Single Family Homes
- The Whitney Plan at Quarry Trails - Single Family Homes
- 2399 Canterbury Rd
- 2414 Brixton Rd
- 2406 Brixton Rd
- 2427 Canterbury Rd
- 2389 Canterbury Rd
- 2398 Brixton Rd
- 2406 Canterbury Rd
- 2398 Canterbury Rd
- 2390 Brixton Rd
- 2377 Canterbury Rd
- 2390 Canterbury Rd
- 2441 Canterbury Rd
- 2428 Canterbury Rd
- 2382 Brixton Rd
- 2450 Brixton Rd
- 2367 Canterbury Rd
- 2374 Brixton Rd
- 2417 Brixton Rd
- 2380 Canterbury Rd
- 2440 Canterbury Rd