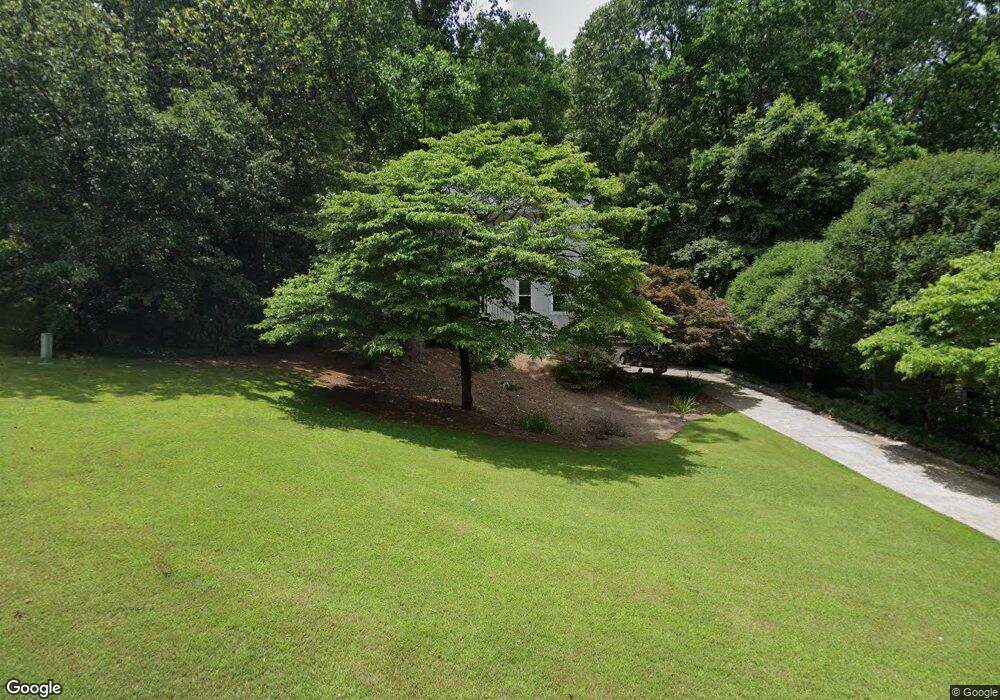
2403 Woodbridge Dr Marietta, GA 30066
Sandy Plains NeighborhoodEstimated Value: $554,424 - $631,000
4
Beds
3
Baths
2,438
Sq Ft
$247/Sq Ft
Est. Value
About This Home
This home is located at 2403 Woodbridge Dr, Marietta, GA 30066 and is currently estimated at $603,356, approximately $247 per square foot. 2403 Woodbridge Dr is a home located in Cobb County with nearby schools including Rocky Mount Elementary School, Mabry Middle School, and Lassiter High School.
Ownership History
Date
Name
Owned For
Owner Type
Purchase Details
Closed on
May 12, 2014
Sold by
Morris Heidi L
Bought by
Morris Heidi L and Schiller George A
Current Estimated Value
Home Financials for this Owner
Home Financials are based on the most recent Mortgage that was taken out on this home.
Original Mortgage
$220,800
Outstanding Balance
$168,039
Interest Rate
4.37%
Mortgage Type
New Conventional
Estimated Equity
$435,317
Purchase Details
Closed on
Jun 16, 2000
Sold by
Hackey James E
Bought by
Hackey James E and Hackey Courtney J
Home Financials for this Owner
Home Financials are based on the most recent Mortgage that was taken out on this home.
Original Mortgage
$183,920
Interest Rate
8.54%
Mortgage Type
New Conventional
Purchase Details
Closed on
Nov 17, 1998
Sold by
Hering Matthew S and Hering Sandra
Bought by
Kennedy Bradley M and Kennedy Kelly S
Home Financials for this Owner
Home Financials are based on the most recent Mortgage that was taken out on this home.
Original Mortgage
$144,500
Interest Rate
6.47%
Mortgage Type
New Conventional
Create a Home Valuation Report for This Property
The Home Valuation Report is an in-depth analysis detailing your home's value as well as a comparison with similar homes in the area
Home Values in the Area
Average Home Value in this Area
Purchase History
| Date | Buyer | Sale Price | Title Company |
|---|---|---|---|
| Morris Heidi L | -- | -- | |
| Morris Heidi L | -- | -- | |
| Hackey James E | -- | -- | |
| Hackey James E | $229,900 | -- | |
| Kennedy Bradley M | $192,700 | -- |
Source: Public Records
Mortgage History
| Date | Status | Borrower | Loan Amount |
|---|---|---|---|
| Open | Morris Heidi L | $220,800 | |
| Previous Owner | Hackey James E | $183,920 | |
| Previous Owner | Kennedy Bradley M | $144,500 |
Source: Public Records
Tax History Compared to Growth
Tax History
| Year | Tax Paid | Tax Assessment Tax Assessment Total Assessment is a certain percentage of the fair market value that is determined by local assessors to be the total taxable value of land and additions on the property. | Land | Improvement |
|---|---|---|---|---|
| 2025 | $5,066 | $209,292 | $48,000 | $161,292 |
| 2024 | $5,070 | $209,292 | $48,000 | $161,292 |
| 2023 | $4,063 | $187,864 | $36,000 | $151,864 |
| 2022 | $3,949 | $156,228 | $36,000 | $120,228 |
| 2021 | $3,540 | $137,580 | $32,800 | $104,780 |
| 2020 | $3,540 | $137,580 | $32,800 | $104,780 |
| 2019 | $3,540 | $137,580 | $32,800 | $104,780 |
| 2018 | $2,952 | $110,680 | $28,000 | $82,680 |
| 2017 | $2,818 | $110,680 | $28,000 | $82,680 |
| 2016 | $2,821 | $110,680 | $28,000 | $82,680 |
| 2015 | $2,393 | $90,068 | $36,000 | $54,068 |
| 2014 | $2,414 | $90,068 | $0 | $0 |
Source: Public Records
Map
Nearby Homes
- 2402 Woodbridge Dr
- 2610 Chadwick Rd
- 2603 Chadwick Rd
- 4050 Idlewilde Meadows Dr NE
- 4056 Longford Dr NE
- 4499 Browning Ct NE
- 2578 Middle Coray Cir
- 2124 Lassiter Field Dr NE
- 4464 Windsor Oaks Dr
- 3816 Havenrock Dr
- 4259 Arbor Club Dr
- 2696 S Arbor Dr
- 3844 Havenrock
- 3812 Havenrock Dr
- 3851 Trickum Rd NE
- 3901 Hazelhurst Dr
- 4509 N Landing Dr
- 3835 Rockhaven Ct
- 2401 Woodbridge Dr
- 2405 Woodbridge Dr
- 2407 Woodbridge Dr
- 2400 Woodbridge Dr
- 2406 Woodbridge Dr
- 2408 Woodbridge Dr
- 2404 Woodbridge Dr Unit 20
- 2404 Woodbridge Dr
- 4143 Brandon Ridge Dr NE
- 4123 Devon Wood Dr NE
- 2412 Woodbridge Dr
- 4280 E Brandon Dr NE Unit 4280
- 4280 E Brandon Dr NE
- 4122 Devon Wood Dr NE
- 4153 Brandon Ridge Dr NE
- 4121 Devon Wood Dr NE
- 4261 Chestnut Walk
- 2413 Woodbridge Dr
- 4263 Chestnut Walk
- 4163 Brandon Ridge Dr NE