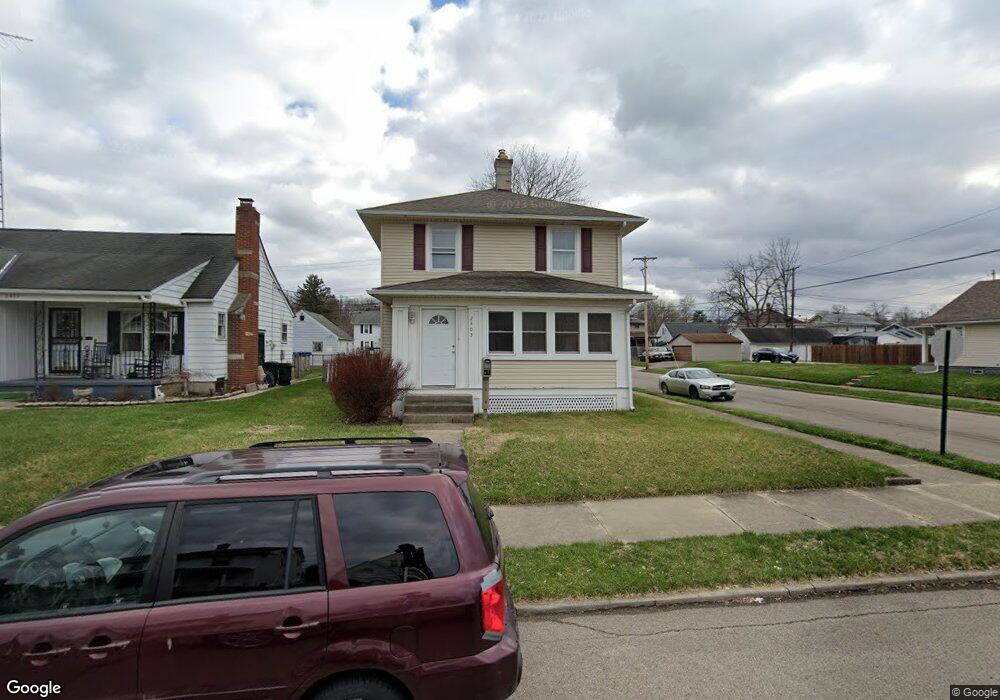
2403 Woodside Ave Springfield, OH 45503
Estimated Value: $141,000 - $160,000
3
Beds
2
Baths
1,152
Sq Ft
$127/Sq Ft
Est. Value
About This Home
This home is located at 2403 Woodside Ave, Springfield, OH 45503 and is currently estimated at $146,561, approximately $127 per square foot. 2403 Woodside Ave is a home located in Clark County with nearby schools including Warder Park-Wayne Elementary School, Schaefer Middle School, and Springfield High School.
Ownership History
Date
Name
Owned For
Owner Type
Purchase Details
Closed on
Dec 18, 2023
Sold by
Craig Roland E and Craig Brenda K
Bought by
Padilla Shelly
Current Estimated Value
Purchase Details
Closed on
Jan 18, 2011
Sold by
Tschida Investments Llc
Bought by
Craig Roland E and Craig Brenda K
Purchase Details
Closed on
Sep 27, 2010
Sold by
Wesbanco Bank Inc
Bought by
Tschida Investments Llc
Purchase Details
Closed on
Oct 24, 2008
Sold by
Christian Jeremy D
Bought by
Wesbanco Bank Inc
Purchase Details
Closed on
Jun 14, 2004
Sold by
Trenner Nancy J
Bought by
Christian Jeremy D and Christian Renee L
Home Financials for this Owner
Home Financials are based on the most recent Mortgage that was taken out on this home.
Original Mortgage
$63,150
Interest Rate
6.46%
Mortgage Type
Purchase Money Mortgage
Purchase Details
Closed on
Mar 5, 1993
Create a Home Valuation Report for This Property
The Home Valuation Report is an in-depth analysis detailing your home's value as well as a comparison with similar homes in the area
Home Values in the Area
Average Home Value in this Area
Purchase History
| Date | Buyer | Sale Price | Title Company |
|---|---|---|---|
| Padilla Shelly | -- | None Listed On Document | |
| Craig Roland E | $70,000 | Ohio Real Estate Title | |
| Tschida Investments Llc | $14,000 | Attorney | |
| Wesbanco Bank Inc | $35,000 | None Available | |
| Christian Jeremy D | $66,500 | -- | |
| -- | -- | -- |
Source: Public Records
Mortgage History
| Date | Status | Borrower | Loan Amount |
|---|---|---|---|
| Previous Owner | Christian Jeremy D | $63,150 |
Source: Public Records
Tax History
| Year | Tax Paid | Tax Assessment Tax Assessment Total Assessment is a certain percentage of the fair market value that is determined by local assessors to be the total taxable value of land and additions on the property. | Land | Improvement |
|---|---|---|---|---|
| 2025 | $2,669 | $48,660 | $5,970 | $42,690 |
| 2024 | $1,721 | $34,840 | $5,460 | $29,380 |
| 2023 | $1,721 | $34,840 | $5,460 | $29,380 |
| 2022 | $1,763 | $34,840 | $5,460 | $29,380 |
| 2021 | $1,277 | $23,230 | $4,260 | $18,970 |
| 2020 | $1,279 | $23,230 | $4,260 | $18,970 |
| 2019 | $1,283 | $23,230 | $4,260 | $18,970 |
| 2018 | $1,200 | $20,860 | $2,660 | $18,200 |
| 2017 | $1,199 | $24,329 | $2,664 | $21,665 |
| 2016 | $1,201 | $24,329 | $2,664 | $21,665 |
| 2015 | $1,324 | $24,329 | $2,664 | $21,665 |
| 2014 | $1,318 | $24,329 | $2,664 | $21,665 |
| 2013 | $812 | $24,329 | $2,664 | $21,665 |
Source: Public Records
Map
Nearby Homes
- 2201 Woodside Ave
- 515 Bellevue Ave
- 419 Bellevue Ave
- 2124 Woodside Ave
- 907 Bellevue Ave
- 2111 Beatrice St
- 2226 Columbus Ave
- 2224-2226 Columbus Ave
- 2020 Woodside Ave
- 2210 Larch St
- 743 N Belmont Ave
- 2023 Cleveland Ave
- 129 N Burnett Rd
- 207 Roseland Ave W
- 2817 Hillside Ave
- 1810 Summit St
- 1830 Edwards Ave
- 1721 Prospect St
- 2424-2426 E High St
- 1682 Edwards Ave
- 2407 Woodside Ave
- 2411 Woodside Ave
- 2325 Woodside Ave
- 2415 Woodside Ave
- 2319 Woodside Ave
- 2402 Beatrice St
- 2406 Beatrice St
- 2410 Beatrice St
- 2324 Beatrice St
- 2315 Woodside Ave
- 2414 Beatrice St
- 2320 Beatrice St
- 2400 Woodside Ave
- 2406 Woodside Ave
- 2423 Woodside Ave
- 753 Bellevue Ave
- 2410 Woodside Ave
- 2233 Woodside Ave
- 2420 Beatrice St
- 2314 Beatrice St
Your Personal Tour Guide
Ask me questions while you tour the home.