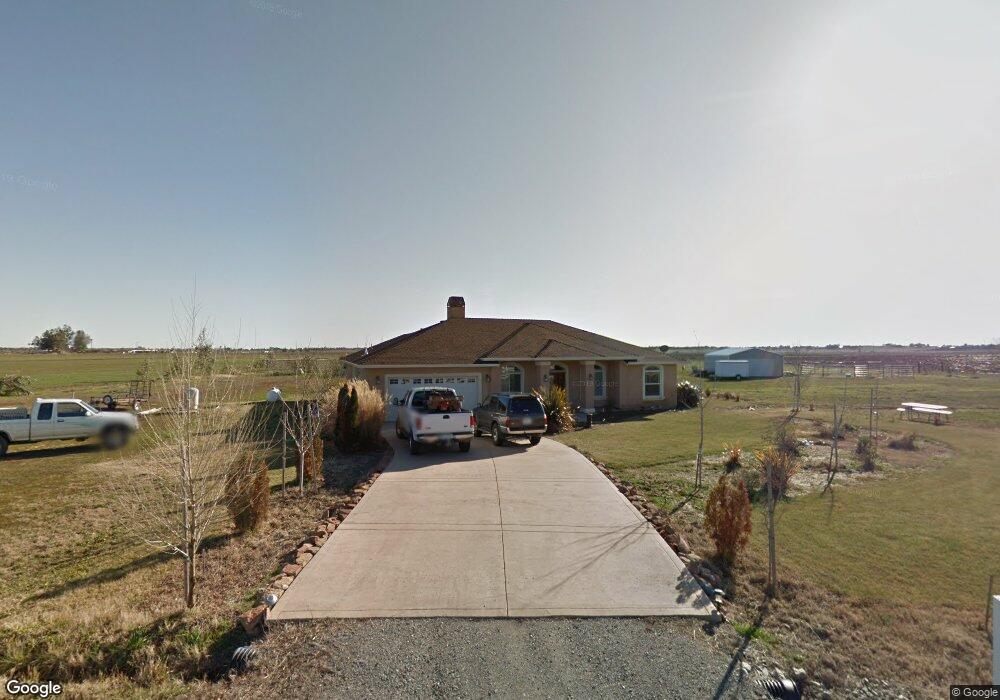
24035 Vine Rd Unit 68 Corning, CA 96021
Estimated Value: $435,000 - $634,000
3
Beds
2
Baths
1,950
Sq Ft
$270/Sq Ft
Est. Value
About This Home
This home is located at 24035 Vine Rd Unit 68, Corning, CA 96021 and is currently estimated at $526,841, approximately $270 per square foot. 24035 Vine Rd Unit 68 is a home located in Tehama County with nearby schools including Richfield Elementary School and Red Bluff High School.
Ownership History
Date
Name
Owned For
Owner Type
Purchase Details
Closed on
May 12, 2008
Sold by
Pacific Holt Corp
Bought by
Sisneros Matthew G
Current Estimated Value
Home Financials for this Owner
Home Financials are based on the most recent Mortgage that was taken out on this home.
Original Mortgage
$280,000
Outstanding Balance
$177,230
Interest Rate
5.87%
Mortgage Type
Unknown
Estimated Equity
$349,611
Purchase Details
Closed on
Jun 20, 2007
Sold by
Fuller Development Llc
Bought by
Pacific Holt Corp
Home Financials for this Owner
Home Financials are based on the most recent Mortgage that was taken out on this home.
Original Mortgage
$310,000
Interest Rate
6.16%
Mortgage Type
Unknown
Purchase Details
Closed on
Jul 18, 2006
Sold by
Fuller Myles and Fuller John
Bought by
Fuller Development Llc
Home Financials for this Owner
Home Financials are based on the most recent Mortgage that was taken out on this home.
Original Mortgage
$110,000
Interest Rate
6.57%
Mortgage Type
Unknown
Create a Home Valuation Report for This Property
The Home Valuation Report is an in-depth analysis detailing your home's value as well as a comparison with similar homes in the area
Purchase History
| Date | Buyer | Sale Price | Title Company |
|---|---|---|---|
| Sisneros Matthew G | $310,000 | Multiple | |
| Pacific Holt Corp | $353,500 | Glenn County Title Company | |
| Fuller Development Llc | -- | Glenn County Title Company |
Source: Public Records
Mortgage History
| Date | Status | Borrower | Loan Amount |
|---|---|---|---|
| Open | Sisneros Matthew G | $280,000 | |
| Previous Owner | Pacific Holt Corp | $310,000 | |
| Previous Owner | Fuller Development Llc | $110,000 |
Source: Public Records
Tax History
| Year | Tax Paid | Tax Assessment Tax Assessment Total Assessment is a certain percentage of the fair market value that is determined by local assessors to be the total taxable value of land and additions on the property. | Land | Improvement |
|---|---|---|---|---|
| 2025 | $4,229 | $416,839 | $144,483 | $272,356 |
| 2023 | $4,149 | $400,654 | $138,873 | $261,781 |
| 2022 | $4,081 | $392,799 | $136,150 | $256,649 |
| 2021 | $3,969 | $385,098 | $133,481 | $251,617 |
| 2020 | $3,528 | $336,730 | $116,188 | $220,542 |
| 2019 | $3,307 | $320,695 | $110,655 | $210,040 |
| 2018 | $3,040 | $291,540 | $100,595 | $190,945 |
| 2017 | $2,793 | $265,036 | $91,450 | $173,586 |
| 2016 | $2,546 | $252,415 | $87,095 | $165,320 |
| 2015 | $2,545 | $252,415 | $87,095 | $165,320 |
| 2014 | $2,226 | $219,492 | $75,735 | $143,757 |
Source: Public Records
Map
Nearby Homes
- 24186 Orangewood Rd
- 0 Richfield Rd
- 6010 Piedmont Rd
- 0 Mary Ave Unit SN25184944
- 4830 Hall Rd
- 24065 Maria Rd
- 0 N Marguerite Ave
- 24680 Florence Ave
- 00 Hall Rd
- 23256 Richfield Rd
- 24565 Foster Rd
- 23848 Hoag Rd
- 00 Mary Ave
- 6064 Alameda Rd
- 24431 Hoag Rd
- 285 Mclane Cir
- 265 Mclane Cir
- 205 Mclane Cir
- 521 Divisidero Ave
- 0 State Highway 99w
- 24035 Vine Rd Unit 8
- 24035 Vine Rd
- 24040 Vine Rd
- 23920 Vine Rd
- 24085 Orangewood Rd
- 23905 Vine Rd
- 5485 Walnut Rd
- 5560 Walnut Rd
- 23965 Orangewood Rd Unit 53
- 23965 Orangewood Rd
- 5410 Walnut Rd
- 24105 Orangewood Rd Unit 7
- 24105 Orangewood Rd
- 20 Hill Rd
- 0000 Hill Rd
- 24090 Orangewood Rd
- 24094 Orangewood Rd
- 23840 Vine Rd
- 23915 Orangewood Rd
- 5370 Walnut Rd
Your Personal Tour Guide
Ask me questions while you tour the home.