2404 21st St Sacramento, CA 95818
Curtis Park NeighborhoodEstimated Value: $907,105
--
Bed
--
Bath
2,700
Sq Ft
$336/Sq Ft
Est. Value
About This Home
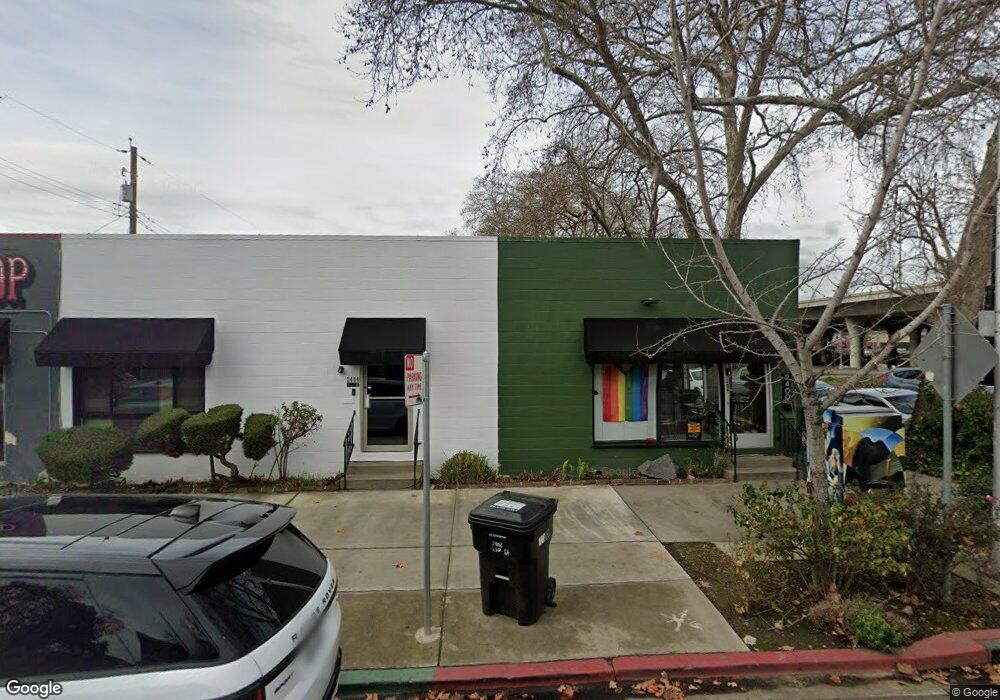
This home is located at 2404 21st St, Sacramento, CA 95818 and is currently estimated at $907,105, approximately $335 per square foot. 2404 21st St is a home located in Sacramento County with nearby schools including William Land Elementary School, Miwok Middle School, and C. K. McClatchy High.
Ownership History
Date
Name
Owned For
Owner Type
Purchase Details
Closed on
Jul 21, 2004
Sold by
Avalos John and Avalos Linda
Bought by
Avalos John J and Avalos Linda A
Current Estimated Value
Purchase Details
Closed on
May 21, 2002
Sold by
Casheros Peter and Casheros Fotine
Bought by
Avalos John and Avalos Linda
Purchase Details
Closed on
Nov 8, 2000
Sold by
Casheros Peter and Casheros Fotine
Bought by
Casheros Peter and Casheros Fotine
Purchase Details
Closed on
May 1, 1997
Sold by
Kambas Alexander
Bought by
Kambas Anastasia
Create a Home Valuation Report for This Property
The Home Valuation Report is an in-depth analysis detailing your home's value as well as a comparison with similar homes in the area
Home Values in the Area
Average Home Value in this Area
Purchase History
| Date | Buyer | Sale Price | Title Company |
|---|---|---|---|
| Avalos John J | -- | -- | |
| Avalos John | $330,000 | Placer Title Company | |
| Casheros Peter | -- | -- | |
| Kambas Anastasia | -- | -- |
Source: Public Records
Tax History Compared to Growth
Tax History
| Year | Tax Paid | Tax Assessment Tax Assessment Total Assessment is a certain percentage of the fair market value that is determined by local assessors to be the total taxable value of land and additions on the property. | Land | Improvement |
|---|---|---|---|---|
| 2025 | $6,334 | $487,489 | $70,898 | $416,591 |
| 2024 | $6,334 | $477,931 | $69,508 | $408,423 |
| 2023 | $6,194 | $468,561 | $68,146 | $400,415 |
| 2022 | $6,096 | $459,374 | $66,810 | $392,564 |
| 2021 | $5,803 | $450,367 | $65,500 | $384,867 |
| 2020 | $5,831 | $445,750 | $64,829 | $380,921 |
| 2019 | $5,703 | $437,010 | $63,558 | $373,452 |
| 2018 | $5,554 | $428,442 | $62,312 | $366,130 |
| 2017 | $5,486 | $420,042 | $61,091 | $358,951 |
| 2016 | $5,270 | $411,807 | $59,894 | $351,913 |
| 2015 | $5,200 | $405,622 | $58,995 | $346,627 |
| 2014 | $5,061 | $397,678 | $57,840 | $339,838 |
Source: Public Records
Map
Nearby Homes