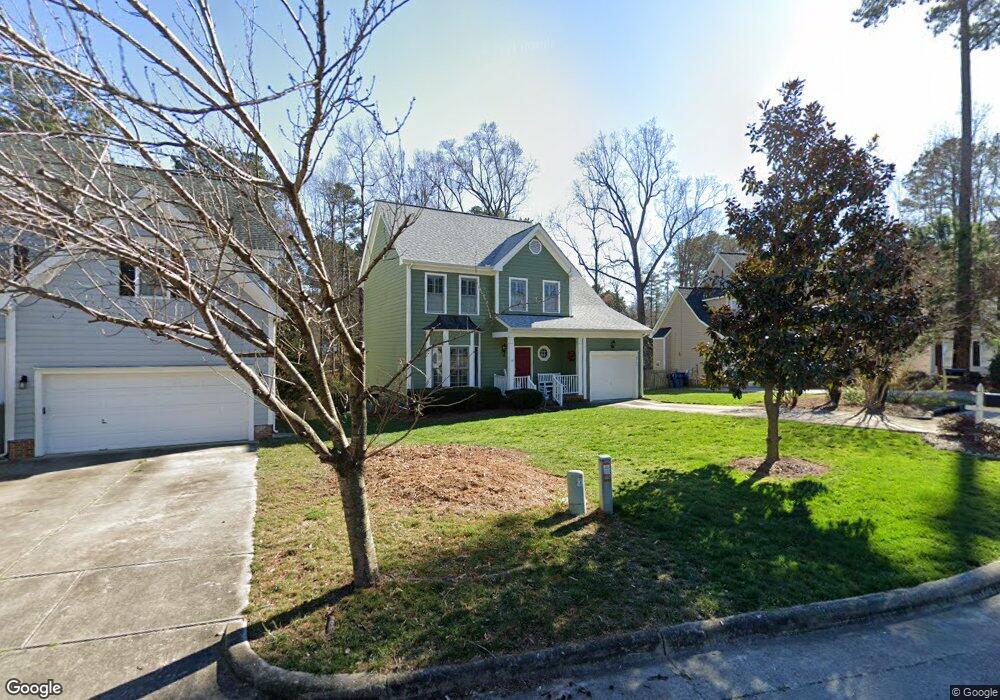
2404 Clerestory Place Raleigh, NC 27615
Estimated Value: $421,546 - $441,000
3
Beds
3
Baths
1,556
Sq Ft
$279/Sq Ft
Est. Value
About This Home
This home is located at 2404 Clerestory Place, Raleigh, NC 27615 and is currently estimated at $433,387, approximately $278 per square foot. 2404 Clerestory Place is a home located in Wake County with nearby schools including North Ridge Elementary School, West Millbrook Middle School, and Millbrook High School.
Ownership History
Date
Name
Owned For
Owner Type
Purchase Details
Closed on
Apr 30, 2013
Sold by
Jennings Thomas B and Jennings Tricia A Stoddard
Bought by
Berube David M
Current Estimated Value
Home Financials for this Owner
Home Financials are based on the most recent Mortgage that was taken out on this home.
Original Mortgage
$172,000
Outstanding Balance
$36,016
Interest Rate
2.77%
Mortgage Type
New Conventional
Estimated Equity
$397,371
Purchase Details
Closed on
Apr 30, 2009
Sold by
Zimmermann Eugene A and Zimmermann William H
Bought by
Jennings Thomas B and Stoddard Tricia A
Home Financials for this Owner
Home Financials are based on the most recent Mortgage that was taken out on this home.
Original Mortgage
$167,850
Interest Rate
5.01%
Mortgage Type
Purchase Money Mortgage
Create a Home Valuation Report for This Property
The Home Valuation Report is an in-depth analysis detailing your home's value as well as a comparison with similar homes in the area
Home Values in the Area
Average Home Value in this Area
Purchase History
| Date | Buyer | Sale Price | Title Company |
|---|---|---|---|
| Berube David M | $192,000 | None Available | |
| Jennings Thomas B | $186,500 | None Available |
Source: Public Records
Mortgage History
| Date | Status | Borrower | Loan Amount |
|---|---|---|---|
| Open | Berube David M | $172,000 | |
| Previous Owner | Jennings Thomas B | $167,850 |
Source: Public Records
Tax History Compared to Growth
Tax History
| Year | Tax Paid | Tax Assessment Tax Assessment Total Assessment is a certain percentage of the fair market value that is determined by local assessors to be the total taxable value of land and additions on the property. | Land | Improvement |
|---|---|---|---|---|
| 2025 | $3,249 | $370,230 | $145,000 | $225,230 |
| 2024 | $3,235 | $370,230 | $145,000 | $225,230 |
| 2023 | $2,937 | $267,630 | $84,000 | $183,630 |
| 2022 | $2,730 | $267,630 | $84,000 | $183,630 |
| 2021 | $2,624 | $267,630 | $84,000 | $183,630 |
| 2020 | $2,576 | $267,630 | $84,000 | $183,630 |
| 2019 | $2,450 | $209,669 | $72,000 | $137,669 |
| 2018 | $2,311 | $209,669 | $72,000 | $137,669 |
| 2017 | $2,201 | $209,669 | $72,000 | $137,669 |
| 2016 | $2,156 | $209,669 | $72,000 | $137,669 |
| 2015 | $2,087 | $199,638 | $62,000 | $137,638 |
| 2014 | $1,980 | $199,638 | $62,000 | $137,638 |
Source: Public Records
Map
Nearby Homes
- 2216 Gresham Lake Rd
- 2309 Clerestory Place
- 2105 Prescott Place
- 7404 Rainwater Rd
- 7620 Rainwater Rd
- 7516 Wingfoot Dr
- 2509 Goudy Dr
- 7316 Massachusetts Ct
- 2301 Declaration Dr
- 1904 Merion Place
- 2317 Declaration Dr
- 2328 Florida Ct
- 2516 Constitution Dr
- 7217 Manor Oaks Dr
- 1925 Hunting Ridge Rd
- 8324 Bellingham Cir
- 2709 Iman Dr
- 7140 N Ridge Dr
- 7019 Litchford Rd
- 2224 Effingham Cir
- 2408 Clerestory Place
- 2400 Clerestory Place
- 2412 Clerestory Place
- 2316 Clerestory Place
- 2312 Clerestory Place
- 2309 Gresham Lake Rd
- 2409 Clerestory Place
- 2416 Clerestory Place
- 2313 Gresham Lake Rd
- 2308 Clerestory Place
- 2413 Clerestory Place
- 2313 Clerestory Place
- 2401 Clerestory Place
- 2420 Clerestory Place
- 2409 Gresham Lake Rd
- 2400 Clinedale Ct
- 2308 Lemuel Dr
- 2417 Clerestory Place
- 2405 Clinedale Ct
- 0 Litchford Rd