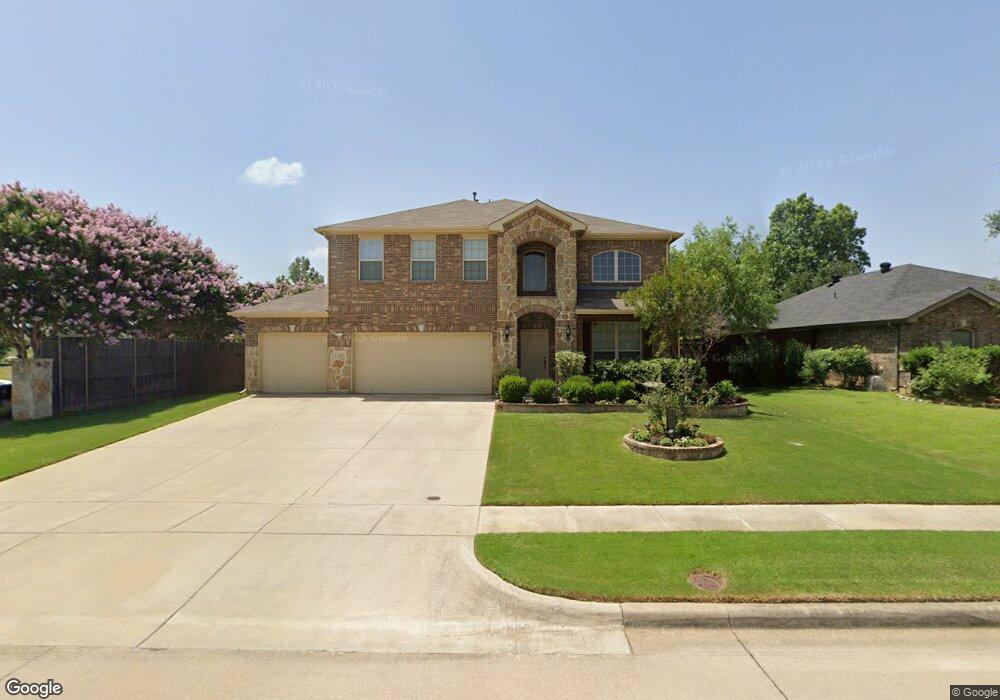
2404 Prescott Downs Dr Denton, TX 76210
South Denton NeighborhoodEstimated Value: $468,000 - $520,000
5
Beds
4
Baths
3,282
Sq Ft
$154/Sq Ft
Est. Value
About This Home
This home is located at 2404 Prescott Downs Dr, Denton, TX 76210 and is currently estimated at $504,025, approximately $153 per square foot. 2404 Prescott Downs Dr is a home located in Denton County with nearby schools including Ryan Elementary School, Crownover Middle School, and Guyer High School.
Ownership History
Date
Name
Owned For
Owner Type
Purchase Details
Closed on
Jan 10, 2019
Sold by
Butterworth Christopher W and Butterworth Betsy R
Bought by
Francis Sajeesh and Premkumari Sheena E
Current Estimated Value
Home Financials for this Owner
Home Financials are based on the most recent Mortgage that was taken out on this home.
Original Mortgage
$308,750
Outstanding Balance
$198,271
Interest Rate
4.8%
Mortgage Type
New Conventional
Estimated Equity
$305,754
Purchase Details
Closed on
Apr 23, 2010
Sold by
Ashton Dallas Residential Llc
Bought by
Butterworth Christopher W and Butterworth Betsy R
Home Financials for this Owner
Home Financials are based on the most recent Mortgage that was taken out on this home.
Original Mortgage
$243,950
Interest Rate
4.91%
Mortgage Type
VA
Create a Home Valuation Report for This Property
The Home Valuation Report is an in-depth analysis detailing your home's value as well as a comparison with similar homes in the area
Home Values in the Area
Average Home Value in this Area
Purchase History
| Date | Buyer | Sale Price | Title Company |
|---|---|---|---|
| Francis Sajeesh | -- | Freedom Title | |
| Butterworth Christopher W | -- | Stnt |
Source: Public Records
Mortgage History
| Date | Status | Borrower | Loan Amount |
|---|---|---|---|
| Open | Francis Sajeesh | $308,750 | |
| Previous Owner | Butterworth Christopher W | $243,950 |
Source: Public Records
Tax History Compared to Growth
Tax History
| Year | Tax Paid | Tax Assessment Tax Assessment Total Assessment is a certain percentage of the fair market value that is determined by local assessors to be the total taxable value of land and additions on the property. | Land | Improvement |
|---|---|---|---|---|
| 2025 | $9,110 | $472,000 | $105,028 | $366,972 |
| 2024 | $9,110 | $472,000 | $105,028 | $366,972 |
| 2023 | $9,700 | $508,000 | $94,390 | $413,610 |
| 2022 | $9,429 | $444,183 | $85,932 | $358,251 |
| 2021 | $8,070 | $363,000 | $52,991 | $310,009 |
| 2020 | $7,543 | $330,000 | $52,991 | $277,009 |
| 2019 | $7,755 | $325,000 | $52,991 | $272,009 |
| 2018 | $7,441 | $308,012 | $52,991 | $266,009 |
| 2017 | $6,921 | $280,011 | $52,991 | $264,357 |
| 2016 | $6,292 | $254,555 | $52,991 | $245,653 |
| 2015 | -- | $231,414 | $41,534 | $189,880 |
| 2013 | -- | $220,684 | $41,534 | $179,150 |
Source: Public Records
Map
Nearby Homes
- 2316 Del Mar Ct
- 2112 Del Mar Ct
- 2825 Desert Dr
- 2109 Hemingway Dr
- 2401 Creekdale Dr
- 2924 Desert Dr
- 1917 Prescott Downs Dr
- 6301 English Saddle Ln
- 4125 Colina Ave
- 1917 Belmont Park Dr
- 2901 Saddle Dr
- 7100 Frost Ln
- 2005 Creekdale Dr
- 5718 Green Ivy Rd
- 7301 Chaucer Dr
- 2412 Miranda Place
- 6201 St James Place
- 2109 Doecrest Dr
- 6509 Wellston Ln
- 7305 Mira Vista Dr
- 2400 Prescott Downs Dr
- 2316 Prescott Downs Dr
- 2401 Fairmount Park Dr
- 2409 Prescott Downs Dr
- 2405 Prescott Downs Dr
- 2401 Prescott Downs Dr
- 2317 Fairmount Park Dr
- 2312 Prescott Downs Dr
- 2313 Fairmount Park Dr
- 2313 Prescott Downs Dr
- 4108 Lone Star Ln
- 2308 Prescott Downs Dr
- 2404 Belmont Park Dr
- 2400 Belmont Park Dr
- 2309 Fairmount Park Dr
- 2408 Belmont Park Dr
- 2309 Prescott Downs Dr
- 4104 Lone Star Ln
- 2316 Belmont Park Dr
- 2304 Prescott Downs Dr