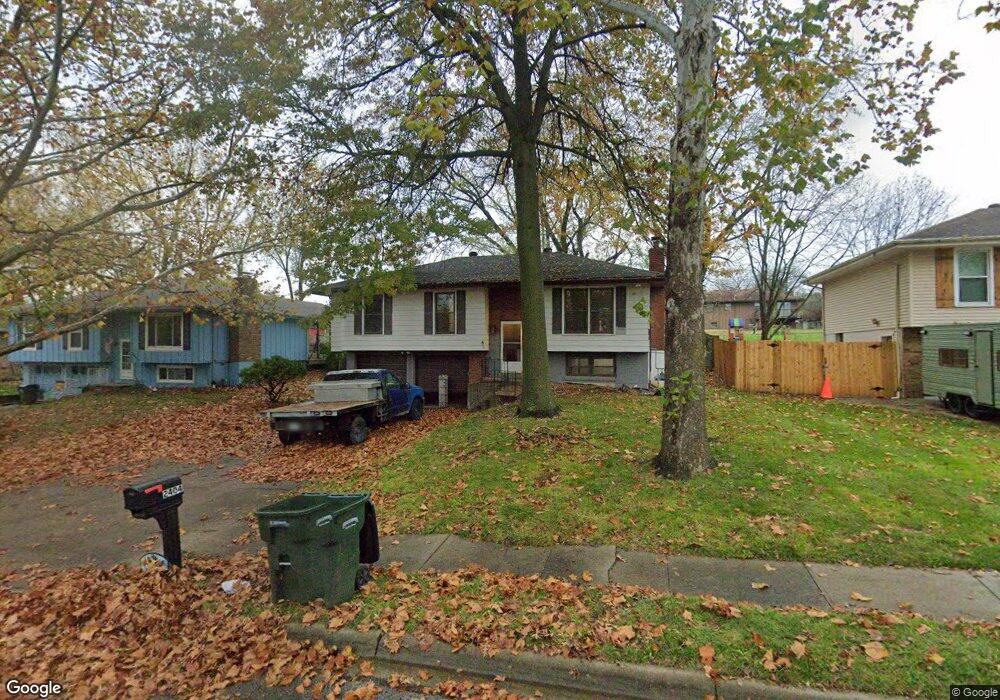
2404 S 16th Terrace Leavenworth, KS 66048
Estimated Value: $228,000 - $248,000
2
Beds
2
Baths
1,080
Sq Ft
$218/Sq Ft
Est. Value
About This Home
This home is located at 2404 S 16th Terrace, Leavenworth, KS 66048 and is currently estimated at $235,757, approximately $218 per square foot. 2404 S 16th Terrace is a home located in Leavenworth County with nearby schools including Henry Leavenworth, Richard Warren Middle School, and Leavenworth Senior High School.
Ownership History
Date
Name
Owned For
Owner Type
Purchase Details
Closed on
Mar 4, 2024
Sold by
Bulging Assets Llc
Bought by
Leadership 101 Llc
Current Estimated Value
Purchase Details
Closed on
Aug 2, 2023
Sold by
Rishworth Robert W
Bought by
Bulging Assets Llc
Purchase Details
Closed on
Aug 1, 2023
Sold by
Rishworth Robert W
Bought by
Bulging Assets Llc
Purchase Details
Closed on
Mar 8, 2023
Sold by
Meath Jayne M
Bought by
Rishworth Robert
Purchase Details
Closed on
Jul 1, 1989
Bought by
Meath Jayne M
Home Financials for this Owner
Home Financials are based on the most recent Mortgage that was taken out on this home.
Original Mortgage
$108,761
Interest Rate
10.07%
Mortgage Type
VA
Create a Home Valuation Report for This Property
The Home Valuation Report is an in-depth analysis detailing your home's value as well as a comparison with similar homes in the area
Home Values in the Area
Average Home Value in this Area
Purchase History
| Date | Buyer | Sale Price | Title Company |
|---|---|---|---|
| Leadership 101 Llc | -- | Lawyers Title | |
| Bulging Assets Llc | -- | None Listed On Document | |
| Bulging Assets Llc | -- | None Listed On Document | |
| Rishworth Robert | -- | Lawyers Title | |
| Meath Jayne M | $64,000 | -- |
Source: Public Records
Mortgage History
| Date | Status | Borrower | Loan Amount |
|---|---|---|---|
| Previous Owner | Meath Jayne M | $108,761 | |
| Closed | Meath Jayne M | $111,564 |
Source: Public Records
Tax History Compared to Growth
Tax History
| Year | Tax Paid | Tax Assessment Tax Assessment Total Assessment is a certain percentage of the fair market value that is determined by local assessors to be the total taxable value of land and additions on the property. | Land | Improvement |
|---|---|---|---|---|
| 2025 | $2,723 | $24,048 | $2,742 | $21,306 |
| 2024 | $2,718 | $23,348 | $2,742 | $20,606 |
| 2023 | $2,718 | $22,668 | $2,742 | $19,926 |
| 2022 | $2,379 | $19,711 | $3,095 | $16,616 |
| 2021 | $2,248 | $17,446 | $3,095 | $14,351 |
| 2020 | $2,058 | $15,829 | $3,095 | $12,734 |
| 2019 | $1,952 | $14,870 | $3,095 | $11,775 |
| 2018 | $1,898 | $14,341 | $3,095 | $11,246 |
| 2017 | $1,812 | $13,915 | $3,095 | $10,820 |
| 2016 | $1,722 | $13,217 | $3,095 | $10,122 |
| 2015 | $1,777 | $13,708 | $3,095 | $10,613 |
| 2014 | $1,745 | $13,524 | $3,095 | $10,429 |
Source: Public Records
Map
Nearby Homes
- 1621 Vilas St
- 1601 Holman St
- 2516 Kensington Place
- 3903 S 20th St
- 2510 S 19th Terrace
- 1316 Vilas St
- 1917 Canterbury Ct
- 1605 Ridge Rd
- 1525 Gatewood St
- 2105 Vilas St
- 2100 Limit St
- 1204 Wildwood St
- 1908 Pine Ridge Dr
- 1036 Vilas St
- 2021 Vilas St
- 2017 Vilas St
- 2308 Hebbeln Dr
- 2248 Vilas St
- 1715 Klemp St
- 1724 Grand Ave
- 2408 S 16th Terrace
- 2400 S 16th Terrace
- 2405 S 17th St
- 2320 S 16th Terrace
- 2412 S 16th Terrace
- 2412 S 16th St
- 2401 S 17th St
- 2409 S 16th St
- 2321 S 17th St
- 2413 S 17th St
- 2405 S 16th Terrace
- 2409 S 16th Terrace
- 2318 S 16th Terrace
- 2420 S 16th Terrace
- 2401 S 16th Terrace
- 2413 S 16th Terrace
- 2317 S 17th St
- 2321 S 16th Terrace
- 2417 S 17th St
- 2316 S 16th Terrace