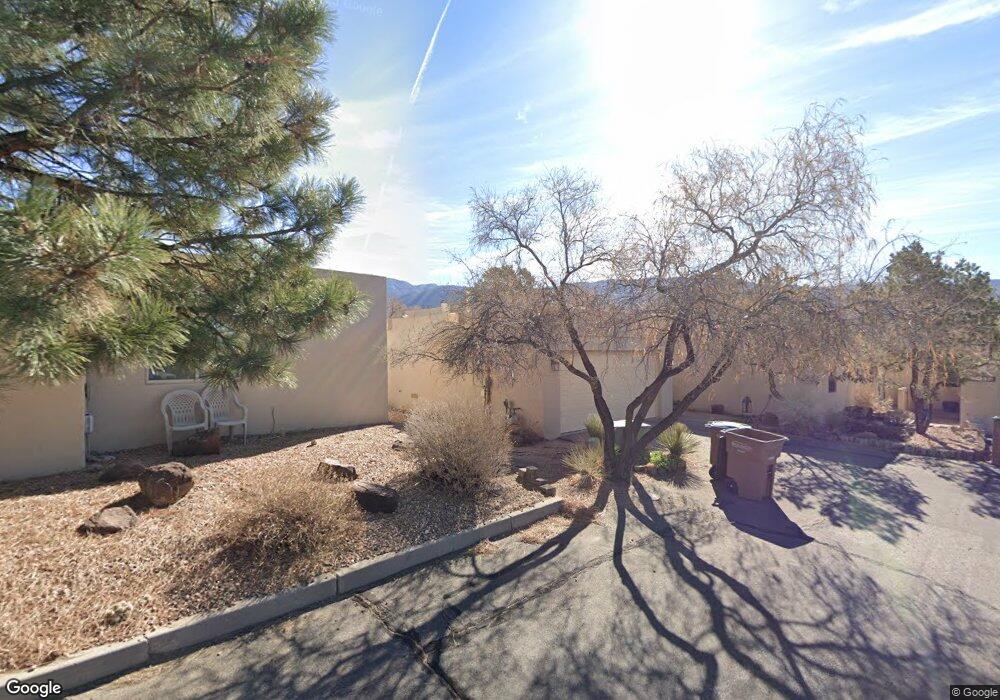
2404 Tramway Terrace Ct NE Albuquerque, NM 87122
Sandia Heights NeighborhoodEstimated Value: $322,672 - $453,000
3
Beds
2
Baths
1,687
Sq Ft
$246/Sq Ft
Est. Value
About This Home
This home is located at 2404 Tramway Terrace Ct NE, Albuquerque, NM 87122 and is currently estimated at $414,418, approximately $245 per square foot. 2404 Tramway Terrace Ct NE is a home located in Bernalillo County with nearby schools including Double Eagle Elementary School, Desert Ridge Middle School, and La Cueva High School.
Ownership History
Date
Name
Owned For
Owner Type
Purchase Details
Closed on
Sep 6, 2017
Sold by
Woods John S and Woods Evelyn D
Bought by
Bouloy Gregory J and Kathleen Bouloy C
Current Estimated Value
Home Financials for this Owner
Home Financials are based on the most recent Mortgage that was taken out on this home.
Original Mortgage
$198,000
Outstanding Balance
$165,037
Interest Rate
3.92%
Mortgage Type
Seller Take Back
Estimated Equity
$249,381
Purchase Details
Closed on
Jun 1, 2006
Sold by
Gilmore Lindalee
Bought by
Gilmore Lindalee and Lobberegt Greg A
Purchase Details
Closed on
Dec 21, 2000
Sold by
Long Herta and Woods Evelyn D
Bought by
Woods John S and Woods Evelyn D
Purchase Details
Closed on
Dec 5, 1998
Sold by
Woods John S and Woods Evelyn D
Bought by
Woods John S and Woods Evelyn D
Purchase Details
Closed on
Dec 4, 1998
Sold by
Long Herta
Bought by
Long Herta and Woods Evelyn D
Create a Home Valuation Report for This Property
The Home Valuation Report is an in-depth analysis detailing your home's value as well as a comparison with similar homes in the area
Home Values in the Area
Average Home Value in this Area
Purchase History
| Date | Buyer | Sale Price | Title Company |
|---|---|---|---|
| Bouloy Gregory J | $200,000 | Fidelity Natl Title Ins Co | |
| Gilmore Lindalee | -- | Us Title | |
| Woods John S | -- | -- | |
| Woods John S | -- | -- | |
| Long Herta | -- | -- |
Source: Public Records
Mortgage History
| Date | Status | Borrower | Loan Amount |
|---|---|---|---|
| Open | Bouloy Gregory J | $198,000 |
Source: Public Records
Tax History Compared to Growth
Tax History
| Year | Tax Paid | Tax Assessment Tax Assessment Total Assessment is a certain percentage of the fair market value that is determined by local assessors to be the total taxable value of land and additions on the property. | Land | Improvement |
|---|---|---|---|---|
| 2025 | $3,403 | $112,900 | $23,182 | $89,718 |
| 2024 | $3,403 | $109,612 | $22,507 | $87,105 |
| 2023 | $3,384 | $106,420 | $21,852 | $84,568 |
| 2022 | $3,237 | $103,321 | $21,216 | $82,105 |
| 2021 | $3,128 | $100,312 | $20,598 | $79,714 |
| 2020 | $3,078 | $97,390 | $19,998 | $77,392 |
| 2019 | $3,077 | $97,390 | $19,998 | $77,392 |
| 2018 | $3,080 | $97,390 | $19,998 | $77,392 |
| 2017 | $2,401 | $98,190 | $19,998 | $78,192 |
| 2016 | $2,325 | $74,461 | $18,453 | $56,008 |
| 2015 | $72,293 | $72,293 | $17,916 | $54,377 |
| 2014 | $2,175 | $70,188 | $17,394 | $52,794 |
| 2013 | -- | $68,144 | $16,888 | $51,256 |
Source: Public Records
Map
Nearby Homes
- 2185 Cattail Willow Ave NE
- 925 Tramway Ln NE
- 8237 Raintree Dr NE
- 906 Tramway Ln NE
- 2108 Navajo Willow Dr NE
- 12405 Palomas Ave NE
- 1704 Quail Run Ct NE
- 12110 Palomas Ave NE
- 412 Live Oak Loop NE
- 11907 San Rafael Ave NE
- 845 Llave Ln NE
- 1239 Rockrose Rd NE
- 450 Live Oak Ln NE
- 6805 Blanket Flower Place NE
- 1562 Eagle Ridge Ct NE
- 793 Tramway Ln NE Unit M
- 348 White Oaks Dr NE
- 1513 Eagle Ridge Rd NE
- 1066 Tramway Ln NE
- 711 Tramway Place NE Unit 30
- 2405 Tramway Terrace Ct NE
- 2406 Tramway Terrace Ct NE
- 2407 Tramway Terrace Ct NE
- 2402 Tramway Terrace Ct NE
- 2450 Tramway Terrace Ct NE
- 2401 Tramway Terrace Ct NE
- 2451 Tramway Terrace Ct NE
- 2408 Tramway Terrace Ct NE
- 2449 Tramway Terrace Ct NE
- 2448 Tramway Terrace Ct NE
- 2409 Tramway Terrace Ct NE
- 2447 Tramway Terrace Ct NE
- 2452 Tramway Terrace Ct NE
- 2453 Tramway Terrace Ct NE
- 2446 Tramway Terrace Ct NE
- 2410 Tramway Terrace Ct NE
- 2454 Tramway Terrace Ct NE
- 2504 Tramway Terrace Ct NE
- 2034 Quail Run Dr NE
- 2411 Tramway Terrace Ct NE