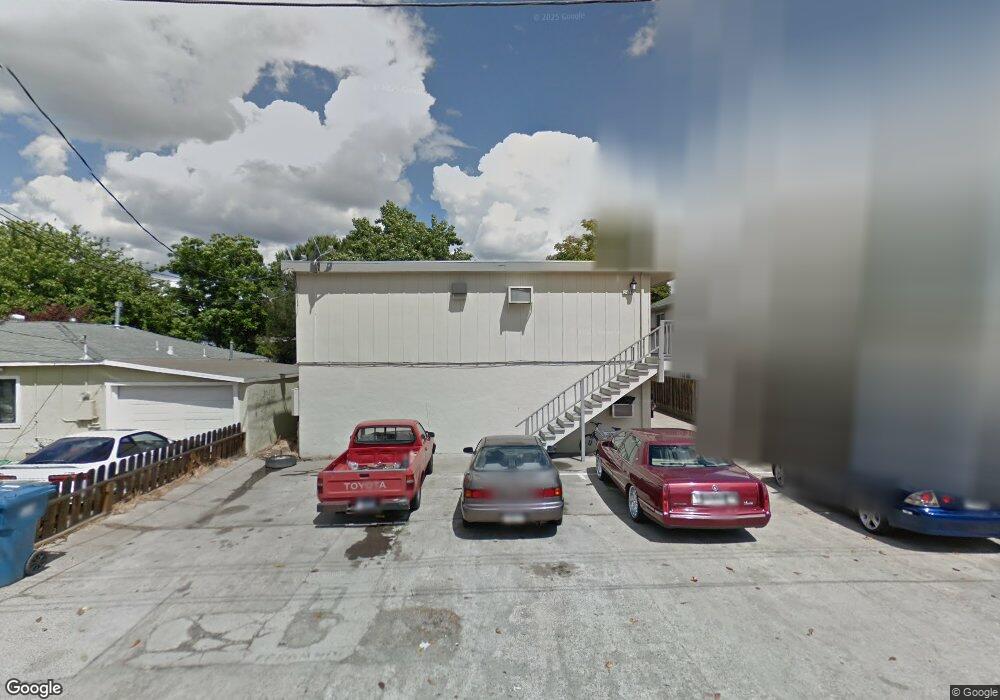
2405 Applegarth Ln Antioch, CA 94509
North Antioch NeighborhoodEstimated Value: $813,000 - $1,166,000
Studio
--
Bath
3,200
Sq Ft
$284/Sq Ft
Est. Value
About This Home
This home is located at 2405 Applegarth Ln, Antioch, CA 94509 and is currently estimated at $908,164, approximately $283 per square foot. 2405 Applegarth Ln is a home located in Contra Costa County with nearby schools including Marsh Elementary School, Antioch Middle School, and Antioch High School.
Ownership History
Date
Name
Owned For
Owner Type
Purchase Details
Closed on
Jan 22, 2016
Current Estimated Value
Home Financials for this Owner
Home Financials are based on the most recent Mortgage that was taken out on this home.
Original Mortgage
$315,000
Outstanding Balance
$247,496
Interest Rate
3.92%
Mortgage Type
New Conventional
Estimated Equity
$660,668
Purchase Details
Closed on
Jan 3, 2016
Home Financials for this Owner
Home Financials are based on the most recent Mortgage that was taken out on this home.
Original Mortgage
$315,000
Outstanding Balance
$247,496
Interest Rate
3.92%
Mortgage Type
New Conventional
Estimated Equity
$660,668
Purchase Details
Closed on
Jun 12, 2008
Purchase Details
Closed on
Mar 17, 2008
Home Financials for this Owner
Home Financials are based on the most recent Mortgage that was taken out on this home.
Original Mortgage
$280,350
Interest Rate
6.04%
Mortgage Type
Purchase Money Mortgage
Purchase Details
Closed on
Dec 21, 2006
Purchase Details
Closed on
Jan 26, 2006
Home Financials for this Owner
Home Financials are based on the most recent Mortgage that was taken out on this home.
Original Mortgage
$648,000
Interest Rate
9.95%
Mortgage Type
Balloon
Purchase Details
Closed on
Feb 17, 2004
Purchase Details
Closed on
May 26, 2000
Home Financials for this Owner
Home Financials are based on the most recent Mortgage that was taken out on this home.
Original Mortgage
$157,500
Interest Rate
4.4%
Mortgage Type
Purchase Money Mortgage
Purchase Details
Closed on
May 24, 2000
Home Financials for this Owner
Home Financials are based on the most recent Mortgage that was taken out on this home.
Original Mortgage
$157,500
Interest Rate
4.4%
Mortgage Type
Purchase Money Mortgage
Purchase Details
Closed on
Aug 25, 1998
Purchase Details
Closed on
May 21, 1997
Home Financials for this Owner
Home Financials are based on the most recent Mortgage that was taken out on this home.
Original Mortgage
$124,000
Interest Rate
7.94%
Mortgage Type
Purchase Money Mortgage
Create a Home Valuation Report for This Property
The Home Valuation Report is an in-depth analysis detailing your home's value as well as a comparison with similar homes in the area
Home Values in the Area
Average Home Value in this Area
Purchase History
| Date | Buyer | Sale Price | Title Company |
|---|---|---|---|
| -- | -- | None Available | |
| -- | $485,000 | Old Republic Title Company | |
| -- | -- | First American Title Company | |
| -- | $400,500 | First American Title Company | |
| -- | $645,000 | First American Title | |
| -- | $648,000 | Alliance Title Company | |
| -- | -- | Placer Title Company | |
| -- | -- | North American Title Co | |
| -- | $210,000 | North American Title Co | |
| -- | -- | -- | |
| -- | $155,000 | Chicago Title Co |
Source: Public Records
Mortgage History
| Date | Status | Borrower | Loan Amount |
|---|---|---|---|
| Open | -- | $315,000 | |
| Previous Owner | -- | $280,350 | |
| Previous Owner | -- | $648,000 | |
| Previous Owner | -- | $157,500 | |
| Previous Owner | -- | $124,000 | |
| Closed | -- | $15,500 |
Source: Public Records
Tax History
| Year | Tax Paid | Tax Assessment Tax Assessment Total Assessment is a certain percentage of the fair market value that is determined by local assessors to be the total taxable value of land and additions on the property. | Land | Improvement |
|---|---|---|---|---|
| 2025 | $8,634 | $574,136 | $147,972 | $426,164 |
| 2024 | $8,107 | $562,879 | $145,071 | $417,808 |
| 2023 | $8,107 | $551,843 | $142,227 | $409,616 |
| 2022 | $8,000 | $541,024 | $139,439 | $401,585 |
| 2021 | $7,685 | $530,416 | $136,705 | $393,711 |
| 2019 | $7,512 | $514,685 | $132,651 | $382,034 |
| 2018 | $7,243 | $504,594 | $130,050 | $374,544 |
| 2017 | $7,036 | $494,700 | $127,500 | $367,200 |
| 2016 | $6,405 | $444,384 | $94,868 | $349,516 |
| 2015 | $5,749 | $388,000 | $82,800 | $305,200 |
| 2014 | $5,330 | $360,000 | $76,800 | $283,200 |
Source: Public Records
Map
Nearby Homes
Your Personal Tour Guide
Ask me questions while you tour the home.