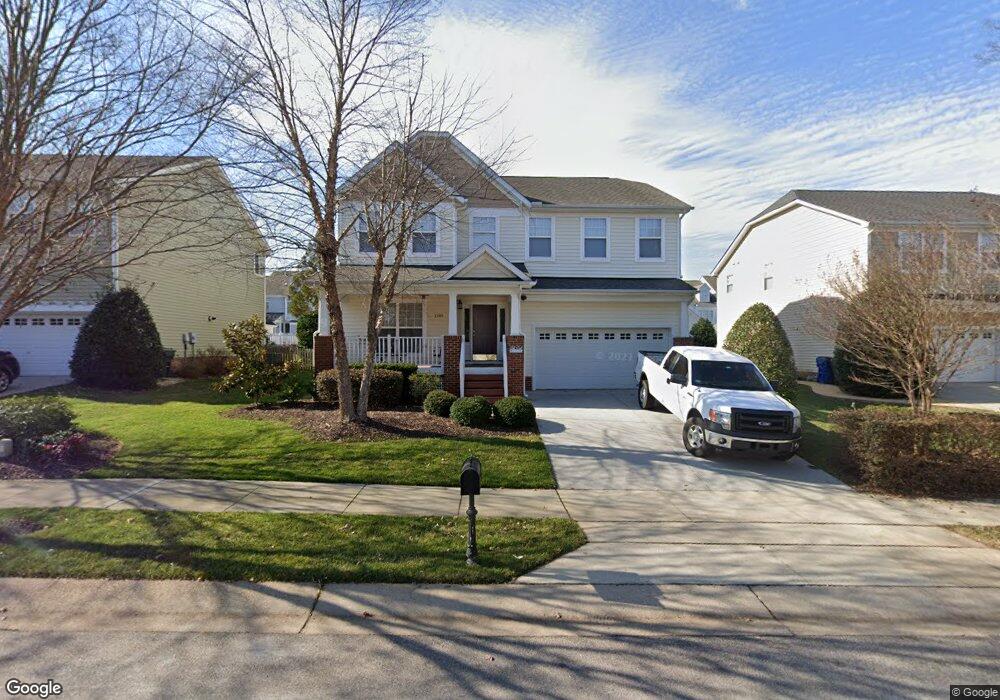
2405 Bright Future Way Raleigh, NC 27614
Bedford at Falls River NeighborhoodEstimated Value: $646,000 - $717,000
4
Beds
3
Baths
2,973
Sq Ft
$231/Sq Ft
Est. Value
About This Home
This home is located at 2405 Bright Future Way, Raleigh, NC 27614 and is currently estimated at $685,776, approximately $230 per square foot. 2405 Bright Future Way is a home located in Wake County with nearby schools including Abbotts Creek Elementary School, Wakefield Middle, and Wakefield High School.
Ownership History
Date
Name
Owned For
Owner Type
Purchase Details
Closed on
Feb 13, 2006
Sold by
Cavalli Carlo A and Cavalli Patrizia Follo
Bought by
Rosbrook Michael S
Current Estimated Value
Home Financials for this Owner
Home Financials are based on the most recent Mortgage that was taken out on this home.
Original Mortgage
$255,900
Outstanding Balance
$157,875
Interest Rate
7.87%
Mortgage Type
Purchase Money Mortgage
Estimated Equity
$527,901
Purchase Details
Closed on
Oct 20, 2004
Sold by
The New Fortis Corp
Bought by
Cavalli Carlo A and Cavalli Patrizia Follo
Home Financials for this Owner
Home Financials are based on the most recent Mortgage that was taken out on this home.
Original Mortgage
$226,200
Interest Rate
4.75%
Mortgage Type
Purchase Money Mortgage
Purchase Details
Closed on
Nov 3, 2003
Sold by
Brandywine Llc
Bought by
The New Fortis Corp
Create a Home Valuation Report for This Property
The Home Valuation Report is an in-depth analysis detailing your home's value as well as a comparison with similar homes in the area
Home Values in the Area
Average Home Value in this Area
Purchase History
| Date | Buyer | Sale Price | Title Company |
|---|---|---|---|
| Rosbrook Michael S | $320,000 | None Available | |
| Cavalli Carlo A | $286,000 | -- | |
| The New Fortis Corp | $612,500 | -- |
Source: Public Records
Mortgage History
| Date | Status | Borrower | Loan Amount |
|---|---|---|---|
| Open | Rosbrook Michael S | $255,900 | |
| Closed | Rosbrook Michael S | $63,950 | |
| Previous Owner | Cavalli Carlo A | $226,200 |
Source: Public Records
Tax History Compared to Growth
Tax History
| Year | Tax Paid | Tax Assessment Tax Assessment Total Assessment is a certain percentage of the fair market value that is determined by local assessors to be the total taxable value of land and additions on the property. | Land | Improvement |
|---|---|---|---|---|
| 2025 | $5,541 | $633,074 | $135,000 | $498,074 |
| 2024 | $5,518 | $633,074 | $135,000 | $498,074 |
| 2023 | $4,423 | $403,941 | $85,000 | $318,941 |
| 2022 | $4,110 | $403,941 | $85,000 | $318,941 |
| 2021 | $3,950 | $403,941 | $85,000 | $318,941 |
| 2020 | $3,878 | $403,941 | $85,000 | $318,941 |
| 2019 | $4,090 | $351,217 | $85,000 | $266,217 |
| 2018 | $3,857 | $351,217 | $85,000 | $266,217 |
| 2017 | $3,674 | $351,217 | $85,000 | $266,217 |
| 2016 | $3,598 | $351,217 | $85,000 | $266,217 |
| 2015 | $3,728 | $358,073 | $90,000 | $268,073 |
| 2014 | -- | $358,073 | $90,000 | $268,073 |
Source: Public Records
Map
Nearby Homes
- 10603 Friendly Neighbor Ln
- 10638 Cardington Ln
- 2408 Gerber Ct
- 2740 Cloud Mist Cir
- 2728 Cloud Mist Cir
- 2231 Cloud Cover
- 10714 Bedfordtown Dr
- 2106 Cloud Cover
- 2704 Snowy Meadow Ct
- 3436 Falls River Ave
- 2220 Raven Rd Unit 104
- 2210 Raven Rd Unit 105
- 2210 Raven Rd Unit 106
- 3405 van Hessen Dr
- 2419 Rogerson St
- 10507 Bedfordtown Dr
- 11309 Shadow Elms Ln
- 3428 van Hessen Dr
- 2221 Valley Edge Dr Unit 105
- 3123 Winding Waters Way
- 2401 Bright Future Way
- 2409 Bright Future Way
- 2315 Bright Future Way
- 2413 Bright Future Way
- 2408 Saint Pauls Square
- 2410 Saint Pauls Square
- 2406 Saint Pauls Square
- 2410 Saint Paul's Square
- 2412 Saint Pauls Square
- 2404 Saint Pauls Square
- 2408 Saint Paul's Square
- 2406 Saint Paul's Square
- 10621 Bedfordtown Dr
- 2402 Saint Pauls Square
- 2412 Saint Paul's Square
- 2414 Saint Pauls Square
- 2404 Saint Paul's Square
- 2400 Saint Paul's Square
- 2416 Saint Pauls Square
- 2402 Saint Paul's Square