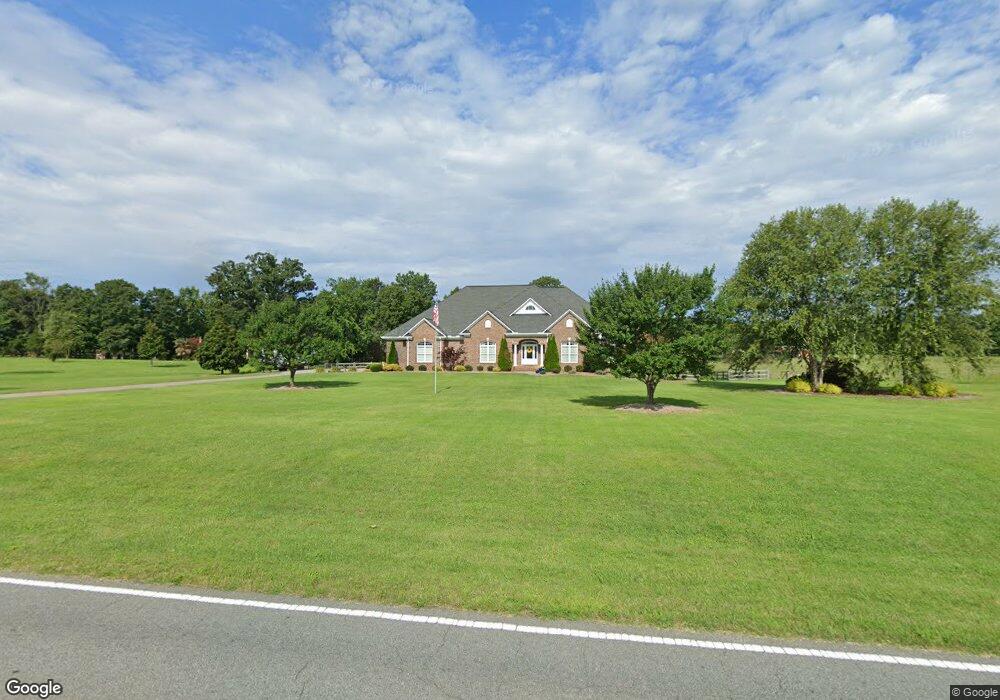
2405 Buffalo Shoals Rd Lincolnton, NC 28092
Estimated Value: $784,000 - $1,104,000
3
Beds
5
Baths
3,360
Sq Ft
$284/Sq Ft
Est. Value
About This Home
This home is located at 2405 Buffalo Shoals Rd, Lincolnton, NC 28092 and is currently estimated at $954,894, approximately $284 per square foot. 2405 Buffalo Shoals Rd is a home located in Lincoln County with nearby schools including Pumpkin Center Primary, Pumpkin Center Intermediate, and Lincolnton Middle School.
Ownership History
Date
Name
Owned For
Owner Type
Purchase Details
Closed on
Jan 31, 2025
Sold by
Fawcett James William and Fawcett Anne Louise
Bought by
Family Trust and Family Trust
Current Estimated Value
Purchase Details
Closed on
Jun 10, 2018
Sold by
Kerley Summer Williams Holt and Kerley Colby
Bought by
Fawcett James W and Fawcett Anne L
Home Financials for this Owner
Home Financials are based on the most recent Mortgage that was taken out on this home.
Original Mortgage
$390,000
Interest Rate
4.6%
Mortgage Type
New Conventional
Purchase Details
Closed on
Apr 19, 2010
Sold by
Kerley Summer Williams Holt and Kerley Colby
Bought by
Kerley Summer Williams Holt and Kerley Colby
Purchase Details
Closed on
Nov 17, 2008
Sold by
Burke Charles R and Burke Carolyn L
Bought by
Holt Summer Williams
Create a Home Valuation Report for This Property
The Home Valuation Report is an in-depth analysis detailing your home's value as well as a comparison with similar homes in the area
Home Values in the Area
Average Home Value in this Area
Purchase History
| Date | Buyer | Sale Price | Title Company |
|---|---|---|---|
| Family Trust | -- | None Listed On Document | |
| Family Trust | -- | None Listed On Document | |
| Fawcett James W | $487,500 | None Available | |
| Kerley Summer Williams Holt | -- | None Available | |
| Holt Summer Williams | $60,000 | None Available |
Source: Public Records
Mortgage History
| Date | Status | Borrower | Loan Amount |
|---|---|---|---|
| Previous Owner | Fawcett James W | $390,000 |
Source: Public Records
Tax History Compared to Growth
Tax History
| Year | Tax Paid | Tax Assessment Tax Assessment Total Assessment is a certain percentage of the fair market value that is determined by local assessors to be the total taxable value of land and additions on the property. | Land | Improvement |
|---|---|---|---|---|
| 2025 | $5,961 | $963,738 | $57,726 | $906,012 |
| 2024 | $5,941 | $963,738 | $57,726 | $906,012 |
| 2023 | $5,791 | $963,738 | $57,726 | $906,012 |
| 2022 | $4,449 | $611,260 | $55,775 | $555,485 |
| 2021 | $4,327 | $611,260 | $55,775 | $555,485 |
| 2020 | $4,089 | $611,260 | $55,775 | $555,485 |
| 2019 | $3,785 | $565,751 | $55,775 | $509,976 |
| 2018 | $3,227 | $459,026 | $55,860 | $403,166 |
| 2017 | $2,988 | $459,026 | $55,860 | $403,166 |
| 2016 | $2,988 | $459,026 | $55,860 | $403,166 |
| 2015 | $3,014 | $459,026 | $55,860 | $403,166 |
| 2014 | $3,188 | $490,545 | $64,981 | $425,564 |
Source: Public Records
Map
Nearby Homes
- 1410 Hickory Nut Ln
- 1723 Ivey Ct
- 00 Clearview Ln
- 1 Clearview Ln
- 3 Old Village Dr Unit 3
- 1452 Kinks Ln
- 214 Springhill Ln
- 2012 Bison Trail
- 772 Car Farm Rd
- 1670 Buck Oak Rd
- 00 Sunrise Trail
- 3249 Ivey Creek Rd
- 2551 Robinette Rd
- 4722 Chapel Rd
- Lot 72 & 73 Meandering Ln Unit 72 & 73
- 00 Meandering Ln
- 2206 Carpenter Farms Dr
- 2202 Carpenter Farms Dr
- 1426 John Lutz Cir
- 3124 Banks St
- 2405 Buffalo Shoals Rd Unit 6
- 2393 Buffalo Shoals Rd
- 2393 Buffalo Shoals Rd Unit 5
- 00 Country Club Dr
- 2383 Buffalo Shoals Rd
- 2435 Buffalo Shoals Rd
- 2384 Buffalo Shoals Rd
- 00 Buffalo Shoals Rd Unit Lots 1-7,9,10,11
- 1210 Shiloh Run Ln
- Lot 40 Shiloh Run Ln
- 00 Shiloh Run Ln Unit 27
- 2503 Buffalo Shoals Rd
- Lot # 9 Shiloh Run Ln
- lot 2 Shiloh Run Ln
- 1218 Shiloh Run Ln
- 2471 Bridle Ct
- Lot 33 Shiloh Run Ln
- Lot 9 Shiloh Run
- Lot 25 Shiloh Run Ln
- Lot 13 Shiloh Run Ln