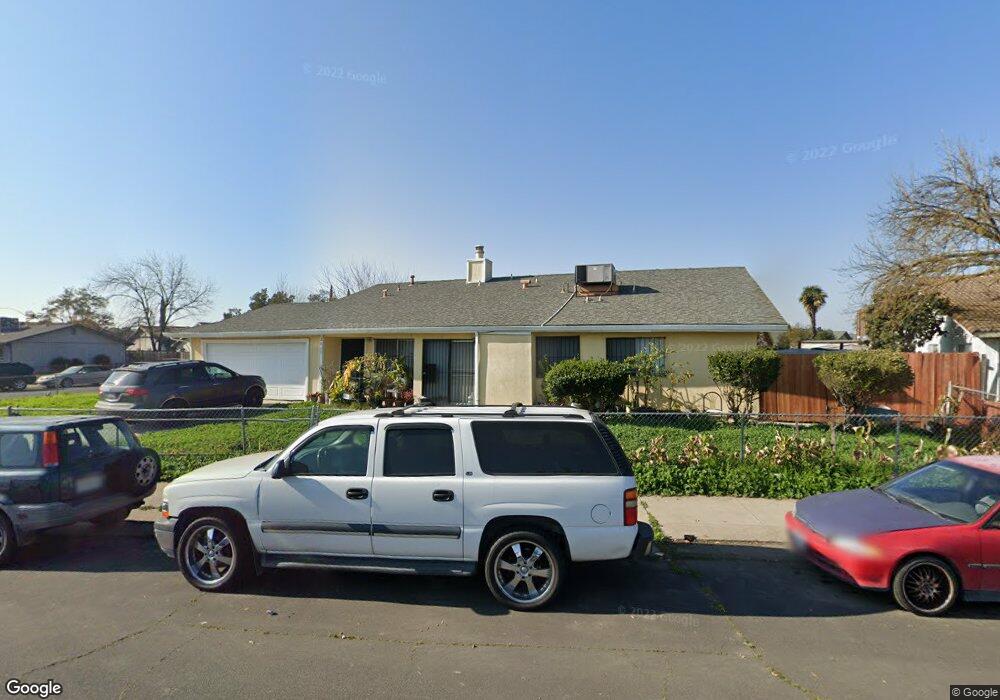
2405 Fleury Way Stockton, CA 95210
Valley Oak NeighborhoodEstimated Value: $351,000 - $480,000
5
Beds
4
Baths
1,999
Sq Ft
$210/Sq Ft
Est. Value
About This Home
This home is located at 2405 Fleury Way, Stockton, CA 95210 and is currently estimated at $420,226, approximately $210 per square foot. 2405 Fleury Way is a home located in San Joaquin County with nearby schools including Clairmont Elementary School, Morada Middle School, and Ronald E. McNair High School.
Ownership History
Date
Name
Owned For
Owner Type
Purchase Details
Closed on
Oct 17, 2019
Sold by
Mir Nisar A and Mir Akhtar B
Bought by
Mir Nisar A and Mir Akhtar B
Current Estimated Value
Home Financials for this Owner
Home Financials are based on the most recent Mortgage that was taken out on this home.
Original Mortgage
$220,500
Outstanding Balance
$193,169
Interest Rate
3.5%
Mortgage Type
New Conventional
Estimated Equity
$227,057
Purchase Details
Closed on
Jul 13, 2018
Sold by
Mir Nisar A and Mir Akhtar B
Bought by
Mir Nisar A and Mir Akhtar B
Purchase Details
Closed on
Jun 20, 2016
Sold by
Mir Imran A and Mir Lubna A
Bought by
Mir Nisar A and Mirr Akhtar B
Purchase Details
Closed on
Feb 19, 2009
Sold by
Bank Of America National Association
Bought by
Mir Imran A and Mir Lubna A
Home Financials for this Owner
Home Financials are based on the most recent Mortgage that was taken out on this home.
Original Mortgage
$99,934
Interest Rate
5.06%
Mortgage Type
FHA
Purchase Details
Closed on
Aug 12, 2008
Sold by
Cao Bang Lu
Bought by
Lasalle Bank Na and The Trust Agreement For The Structured A
Purchase Details
Closed on
Jul 13, 2004
Sold by
Lu Phu
Bought by
Cao Bang Lu
Home Financials for this Owner
Home Financials are based on the most recent Mortgage that was taken out on this home.
Original Mortgage
$204,750
Interest Rate
7.3%
Mortgage Type
Purchase Money Mortgage
Purchase Details
Closed on
Feb 19, 2002
Sold by
Lu Phu
Bought by
Cao Bang Lu and Lu Phu
Purchase Details
Closed on
Jun 18, 2001
Sold by
Seraypheap Youn and Seraypheap Arunny Hin
Bought by
Lu Phu
Home Financials for this Owner
Home Financials are based on the most recent Mortgage that was taken out on this home.
Original Mortgage
$108,062
Interest Rate
7.14%
Mortgage Type
Stand Alone First
Purchase Details
Closed on
Oct 22, 1999
Sold by
Hull Family Properties Llc
Bought by
Seraypheap Youn
Home Financials for this Owner
Home Financials are based on the most recent Mortgage that was taken out on this home.
Original Mortgage
$57,600
Interest Rate
3.85%
Purchase Details
Closed on
Oct 28, 1997
Sold by
Hull Family Properties Llc
Bought by
Hull Hull W and Hull Sharon L
Home Financials for this Owner
Home Financials are based on the most recent Mortgage that was taken out on this home.
Original Mortgage
$50,000
Interest Rate
6.62%
Purchase Details
Closed on
May 27, 1997
Sold by
Arthur Mow and Mow Victor
Bought by
Hull Family Properties Llc
Create a Home Valuation Report for This Property
The Home Valuation Report is an in-depth analysis detailing your home's value as well as a comparison with similar homes in the area
Home Values in the Area
Average Home Value in this Area
Purchase History
| Date | Buyer | Sale Price | Title Company |
|---|---|---|---|
| Mir Nisar A | -- | Old Republic Title Co San | |
| Mir Nisar A | -- | None Available | |
| Mir Nisar A | -- | None Available | |
| Mir Imran A | $91,000 | North American Title Co | |
| Lasalle Bank Na | $117,000 | Accommodation | |
| Cao Bang Lu | -- | Alliance Title Co | |
| Cao Bang Lu | -- | -- | |
| Lu Phu | $133,000 | First American Title Co | |
| Seraypheap Youn | $72,000 | First American Title Co | |
| Hull Family Properties Llc | -- | First American Title Co | |
| Hull Hull W | -- | Central Valley Title Company | |
| Hull Family Properties Llc | -- | Central Valley Title Company |
Source: Public Records
Mortgage History
| Date | Status | Borrower | Loan Amount |
|---|---|---|---|
| Open | Mir Nisar A | $220,500 | |
| Previous Owner | Mir Imran A | $99,934 | |
| Previous Owner | Cao Bang Lu | $204,750 | |
| Previous Owner | Lu Phu | $108,062 | |
| Previous Owner | Seraypheap Youn | $57,600 | |
| Previous Owner | Hull Hull W | $50,000 |
Source: Public Records
Tax History Compared to Growth
Tax History
| Year | Tax Paid | Tax Assessment Tax Assessment Total Assessment is a certain percentage of the fair market value that is determined by local assessors to be the total taxable value of land and additions on the property. | Land | Improvement |
|---|---|---|---|---|
| 2025 | $1,353 | $117,174 | $45,066 | $72,108 |
| 2024 | $1,328 | $114,878 | $44,183 | $70,695 |
| 2023 | $1,313 | $112,626 | $43,317 | $69,309 |
| 2022 | $1,282 | $110,418 | $42,468 | $67,950 |
| 2021 | $1,311 | $108,254 | $41,636 | $66,618 |
| 2020 | $1,280 | $107,145 | $41,210 | $65,935 |
| 2019 | $1,251 | $105,045 | $40,402 | $64,643 |
| 2018 | $1,229 | $102,986 | $39,610 | $63,376 |
| 2017 | $1,200 | $100,968 | $38,834 | $62,134 |
| 2016 | $1,131 | $98,989 | $38,073 | $60,916 |
| 2015 | $1,132 | $97,503 | $37,501 | $60,002 |
| 2014 | $1,115 | $95,594 | $36,767 | $58,827 |
Source: Public Records
Map
Nearby Homes
- 8007 Lorraine Ave
- 8107 8107 Grenoble Way
- 8110 Rouen Ct
- 7238 Sharkon Ln
- 7127 Tristan Cir Unit 10
- 7112 Tristan Cir
- 1926 Shameran St
- 7028 Tristan Cir
- 1657 Knickerbocker Dr
- 8153 Moulin Ct
- 1864 Caleb Cir
- 8600 West Ln Unit 154
- 8600 West Ln Unit 116
- 8600 West Ln Unit 68
- 8600 West Ln Unit 92
- 8600 West Ln Unit 172
- 8600 West Ln Unit 76
- 8837 Fox Creek Dr Unit 1
- 1537 Pyrenees Ave Unit 21
- 1545 Pyrenees Ave Unit 27
- 8008 Bernay Dr
- 8009 Champagne Dr
- 8014 Bernay Dr
- 8017 Champagne Dr
- 2408 Fleury Way
- 2414 Fleury Way
- 2338 Bernay Ct
- 2402 Fleury Way
- 8022 Bernay Dr
- 7957 Bernay Dr
- 7949 Bernay Dr
- 8025 Champagne Dr
- 2420 Fleury Way
- 7941 Bernay Dr
- 8005 Bernay Dr
- 2332 Bernay Ct
- 8030 Bernay Dr
- 2506 Fleury Way Unit 2
- 2506 Fleury Way
- 2509 Fleury Way