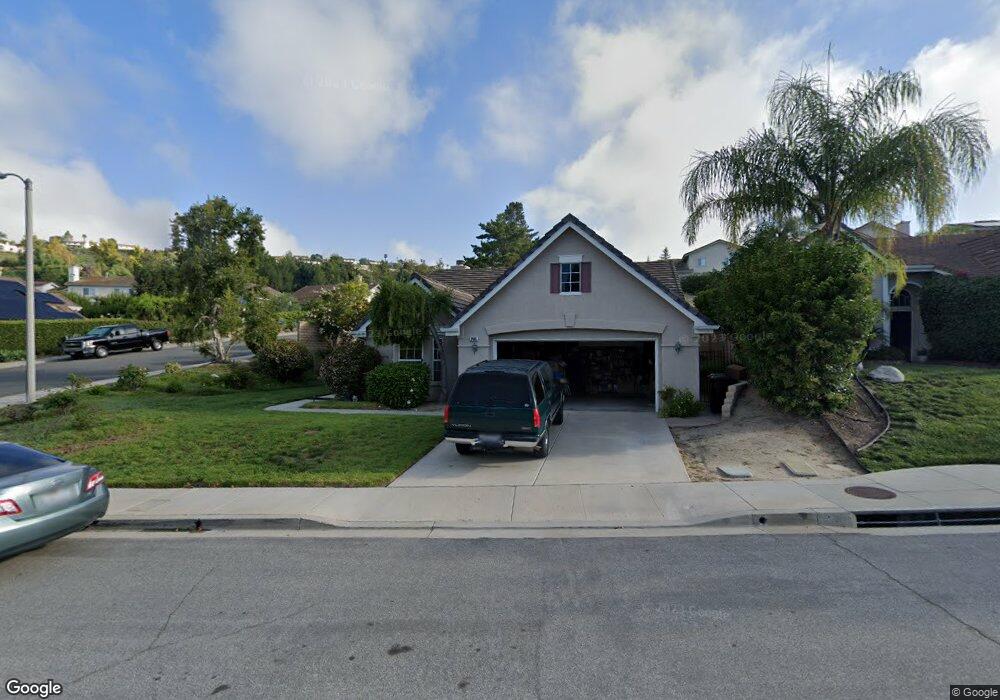
2405 Gillingham Cir Thousand Oaks, CA 91362
Estimated Value: $1,172,000 - $1,263,000
4
Beds
2
Baths
1,963
Sq Ft
$616/Sq Ft
Est. Value
About This Home
This home is located at 2405 Gillingham Cir, Thousand Oaks, CA 91362 and is currently estimated at $1,209,429, approximately $616 per square foot. 2405 Gillingham Cir is a home located in Ventura County with nearby schools including Lang Ranch, Los Cerritos Middle School, and Westlake High School.
Ownership History
Date
Name
Owned For
Owner Type
Purchase Details
Closed on
Apr 10, 2009
Sold by
Shannon George Mathew and Shannon Linda Ann
Bought by
Shannon George M and Shannon Linda A
Current Estimated Value
Home Financials for this Owner
Home Financials are based on the most recent Mortgage that was taken out on this home.
Original Mortgage
$275,000
Outstanding Balance
$175,980
Interest Rate
5.17%
Mortgage Type
New Conventional
Estimated Equity
$1,033,449
Purchase Details
Closed on
Jun 14, 2007
Sold by
Shannon George Matthew and Shannon Linda Ann
Bought by
Shannon George M and Shannon Linda A
Purchase Details
Closed on
Aug 30, 1995
Sold by
Standard Pacific Corp
Bought by
Shannon George Matthew and Shannon Linda Ann
Home Financials for this Owner
Home Financials are based on the most recent Mortgage that was taken out on this home.
Original Mortgage
$260,950
Interest Rate
7.88%
Create a Home Valuation Report for This Property
The Home Valuation Report is an in-depth analysis detailing your home's value as well as a comparison with similar homes in the area
Home Values in the Area
Average Home Value in this Area
Purchase History
| Date | Buyer | Sale Price | Title Company |
|---|---|---|---|
| Shannon George M | -- | Accommodation | |
| Shannon George Mathew | -- | Fidelity National Title Co | |
| Shannon George M | -- | None Available | |
| Shannon George Matthew | $290,000 | Chicago Title |
Source: Public Records
Mortgage History
| Date | Status | Borrower | Loan Amount |
|---|---|---|---|
| Open | Shannon George Mathew | $275,000 | |
| Closed | Shannon George Matthew | $260,950 |
Source: Public Records
Tax History Compared to Growth
Tax History
| Year | Tax Paid | Tax Assessment Tax Assessment Total Assessment is a certain percentage of the fair market value that is determined by local assessors to be the total taxable value of land and additions on the property. | Land | Improvement |
|---|---|---|---|---|
| 2025 | $5,831 | $481,603 | $192,635 | $288,968 |
| 2024 | $5,831 | $472,160 | $188,858 | $283,302 |
| 2023 | $5,651 | $462,902 | $185,154 | $277,748 |
| 2022 | $5,535 | $453,826 | $181,524 | $272,302 |
| 2021 | $5,418 | $444,928 | $177,965 | $266,963 |
| 2020 | $4,988 | $440,368 | $176,141 | $264,227 |
| 2019 | $4,854 | $431,735 | $172,688 | $259,047 |
| 2018 | $4,752 | $423,270 | $169,302 | $253,968 |
| 2017 | $4,654 | $414,972 | $165,983 | $248,989 |
| 2016 | $4,604 | $406,836 | $162,729 | $244,107 |
| 2015 | $4,520 | $400,728 | $160,286 | $240,442 |
| 2014 | $4,451 | $392,881 | $157,148 | $235,733 |
Source: Public Records
Map
Nearby Homes
- 2347 Laurelwood Dr
- 2848 Bayham Cir
- 2906 Evesham Ave
- 3249 Springbrook St
- 2499 Springbrook St
- 2427 Springbrook St
- 2217 Laurelwood Dr
- 2780 Blazing Star Dr
- 2827 Arbella Ln
- 2996 Eagles Claw Ave
- 3128 Casino Dr
- 3225 Futura Point
- 2001 Brookfield Dr
- 1915 Woodside Dr
- 2162 Shady Brook Dr
- 2724 Capella Way
- 2252 Northpark St
- 2681 Briarwood Place
- 3375 Montagne Way
- 3178 Sunset Hills Blvd
- 2417 Gillingham Cir
- 2399 Gillingham Cir
- 2429 Gillingham Cir
- 2472 Rutland Place
- 2480 Rutland Place
- 2441 Gillingham Cir
- 2488 Rutland Place
- 2404 Gillingham Cir
- 2416 Gillingham Cir
- 2395 Gillingham Cir
- 2452 Rutland Place
- 2428 Gillingham Cir
- 2496 Rutland Place
- 2440 Gillingham Cir
- 2436 Rutland Place
- 2453 Gillingham Cir
- 2398 Gillingham Cir
- 2391 Gillingham Cir
- 2452 Gillingham Cir
- 2504 Rutland Place