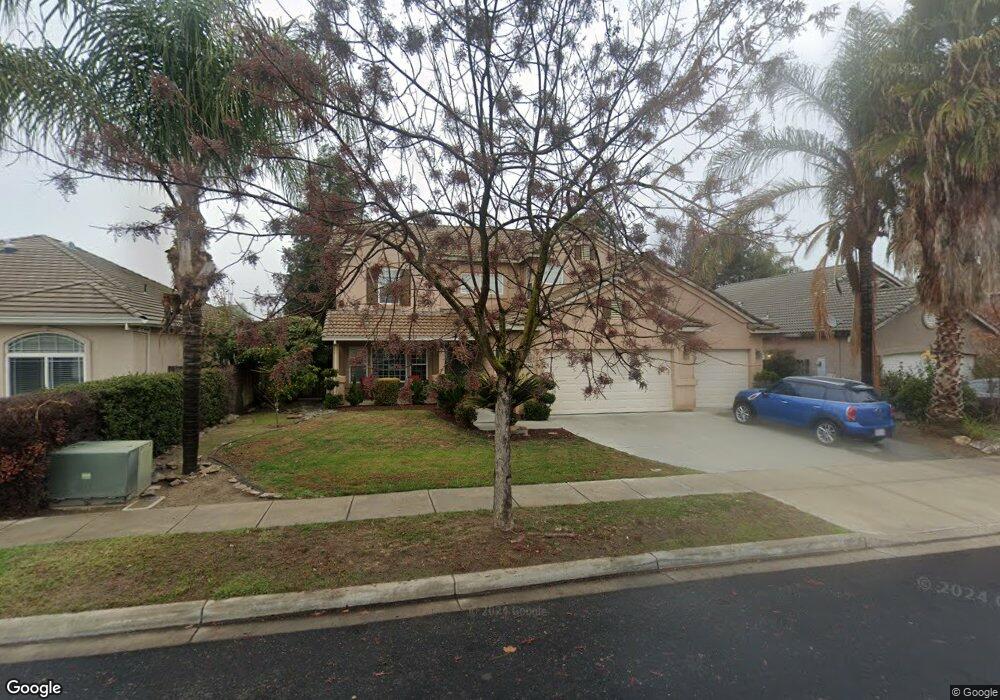
2405 Oak Crest Dr Turlock, CA 95382
Estimated Value: $593,000 - $665,000
4
Beds
3
Baths
2,618
Sq Ft
$238/Sq Ft
Est. Value
About This Home
This home is located at 2405 Oak Crest Dr, Turlock, CA 95382 and is currently estimated at $622,433, approximately $237 per square foot. 2405 Oak Crest Dr is a home located in Stanislaus County with nearby schools including Sandra Tovar Medeiros Elementary School, Turlock Junior High School, and Marvin A. Dutcher Middle School.
Ownership History
Date
Name
Owned For
Owner Type
Purchase Details
Closed on
Apr 23, 2009
Sold by
Aurora Loan Services Llc
Bought by
Poolis Claudia
Current Estimated Value
Purchase Details
Closed on
Jan 28, 2009
Sold by
Calixto Joel D and Lazaro Maria G
Bought by
Aurora Loan Services Llc
Purchase Details
Closed on
May 25, 2007
Sold by
Maciel Salvador and Maciel Cynthia
Bought by
Calixto Joel D and Lazaro Maira G
Home Financials for this Owner
Home Financials are based on the most recent Mortgage that was taken out on this home.
Original Mortgage
$405,000
Interest Rate
7.87%
Mortgage Type
Negative Amortization
Purchase Details
Closed on
Sep 12, 2001
Sold by
Jkb Homes Corp
Bought by
Maciel Salvador and Maciel Cynthia
Home Financials for this Owner
Home Financials are based on the most recent Mortgage that was taken out on this home.
Original Mortgage
$95,450
Interest Rate
6.8%
Create a Home Valuation Report for This Property
The Home Valuation Report is an in-depth analysis detailing your home's value as well as a comparison with similar homes in the area
Purchase History
| Date | Buyer | Sale Price | Title Company |
|---|---|---|---|
| Poolis Claudia | $255,000 | North American Title Company | |
| Aurora Loan Services Llc | $303,000 | Accommodation | |
| Calixto Joel D | $450,000 | Stewart Title Of Ca Inc | |
| Maciel Salvador | $274,500 | Fidelity National Title Co |
Source: Public Records
Mortgage History
| Date | Status | Borrower | Loan Amount |
|---|---|---|---|
| Previous Owner | Calixto Joel D | $405,000 | |
| Previous Owner | Maciel Salvador | $95,450 | |
| Closed | Maciel Salvador | $75,000 |
Source: Public Records
Tax History
| Year | Tax Paid | Tax Assessment Tax Assessment Total Assessment is a certain percentage of the fair market value that is determined by local assessors to be the total taxable value of land and additions on the property. | Land | Improvement |
|---|---|---|---|---|
| 2025 | $3,705 | $328,364 | $83,697 | $244,667 |
| 2024 | $3,768 | $321,926 | $82,056 | $239,870 |
| 2023 | $3,913 | $315,615 | $80,448 | $235,167 |
| 2022 | $3,862 | $309,427 | $78,871 | $230,556 |
| 2021 | $3,753 | $303,361 | $77,325 | $226,036 |
| 2020 | $3,720 | $300,252 | $76,533 | $223,719 |
| 2019 | $3,641 | $294,366 | $75,033 | $219,333 |
| 2018 | $3,637 | $288,595 | $73,562 | $215,033 |
| 2017 | $3,527 | $282,937 | $72,120 | $210,817 |
| 2016 | $3,314 | $277,390 | $70,706 | $206,684 |
| 2015 | $3,278 | $273,224 | $69,644 | $203,580 |
| 2014 | $3,241 | $267,873 | $68,280 | $199,593 |
Source: Public Records
Map
Nearby Homes
- 2730 Explorer Way
- 2783 Explorer Way
- 2394 Tea Rose St
- 4213 Montara Dr
- 3350 Spring Garden Dr
- 3293 Dewar Ln
- 2352 Hidden Springs Ct
- 1360 Shady Ln Unit 923
- 1360 Shady Ln Unit 733
- 1360 Shady Ln Unit 1022
- 2315 Merriment Ct
- 99 Golden State Hwy
- 1232 Paseo Belleza
- 2531 Craftsman St
- 4184 Horizon Ct
- 2470 Sea Lion Way
- 2755 N Walnut Rd Unit 114
- 2091 State St
- 5201 N Tully Rd
- 2500 W Barnhart Rd
- 2375 Oak Crest Dr
- 2425 Oak Crest Dr
- 2406 Silver Leaf Ln
- 2355 Oak Crest Dr
- 2445 Oak Crest Dr
- 2386 Silver Leaf Ln
- 2404 Oak Crest Dr
- 2366 Silver Leaf Ln
- 2424 Oak Crest Dr
- 2384 Oak Crest Dr
- 2465 Oak Crest Dr
- 3845 Sterling Ridge Dr
- 2444 Oak Crest Dr
- 3865 Sterling Ridge Dr
- 2364 Oak Crest Dr
- 2485 Oak Crest Dr
- 3885 Sterling Ridge Dr
- 2464 Oak Crest Dr
- 2344 Oak Crest Dr
- 2399 Autumn Moon Way
Your Personal Tour Guide
Ask me questions while you tour the home.