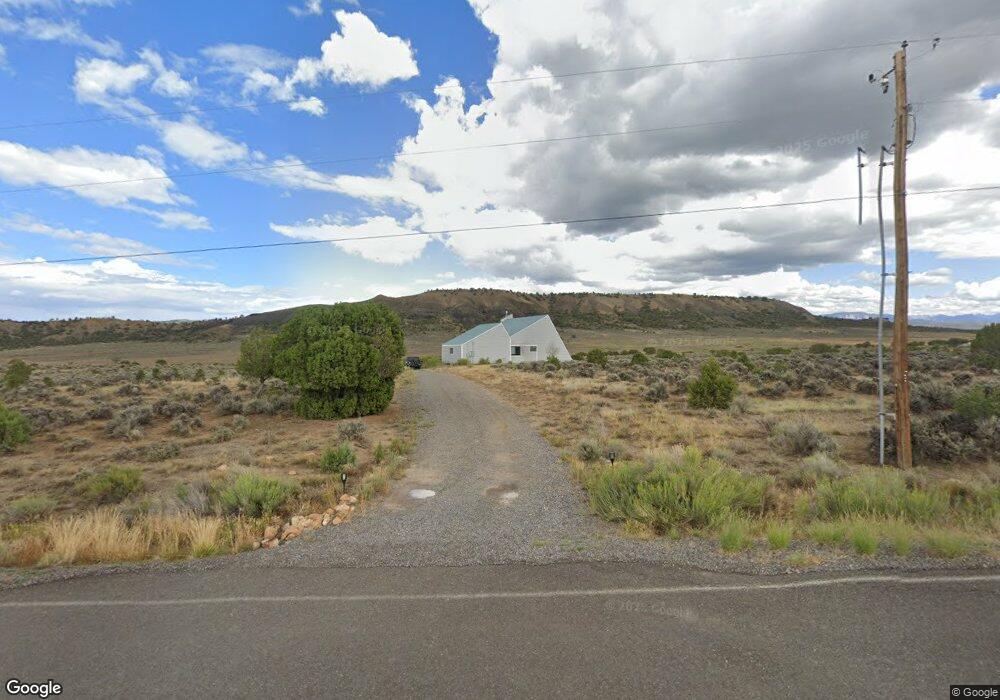
24050 Horsefly Rd Montrose, CO 81403
Estimated Value: $788,000 - $993,000
5
Beds
4
Baths
3,590
Sq Ft
$257/Sq Ft
Est. Value
About This Home
This home is located at 24050 Horsefly Rd, Montrose, CO 81403 and is currently estimated at $922,233, approximately $256 per square foot. 24050 Horsefly Rd is a home located in Montrose County with nearby schools including Cottonwood Elementary School, Columbine Middle School, and Montrose High School.
Ownership History
Date
Name
Owned For
Owner Type
Purchase Details
Closed on
May 21, 2018
Sold by
Wallingford Richard L
Bought by
Gross Andrew Lane
Current Estimated Value
Home Financials for this Owner
Home Financials are based on the most recent Mortgage that was taken out on this home.
Original Mortgage
$336,000
Outstanding Balance
$199,075
Interest Rate
4.4%
Estimated Equity
$723,158
Purchase Details
Closed on
Jun 29, 2012
Sold by
Shad Grenvieve D
Bought by
Wallingford Richard L and Wallingford Heather F
Home Financials for this Owner
Home Financials are based on the most recent Mortgage that was taken out on this home.
Original Mortgage
$216,000
Interest Rate
3.8%
Purchase Details
Closed on
Sep 21, 1994
Sold by
Vandervort Dwight E
Bought by
Shand Jack A and Shand Genevieve D
Create a Home Valuation Report for This Property
The Home Valuation Report is an in-depth analysis detailing your home's value as well as a comparison with similar homes in the area
Home Values in the Area
Average Home Value in this Area
Purchase History
| Date | Buyer | Sale Price | Title Company |
|---|---|---|---|
| Gross Andrew Lane | $420,000 | Land Title Guarantee Co | |
| Wallingford Richard L | $270,000 | Land Title | |
| Shand Jack A | $53,300 | -- |
Source: Public Records
Mortgage History
| Date | Status | Borrower | Loan Amount |
|---|---|---|---|
| Open | Gross Andrew Lane | $336,000 | |
| Previous Owner | Wallingford Richard L | $216,000 |
Source: Public Records
Tax History Compared to Growth
Tax History
| Year | Tax Paid | Tax Assessment Tax Assessment Total Assessment is a certain percentage of the fair market value that is determined by local assessors to be the total taxable value of land and additions on the property. | Land | Improvement |
|---|---|---|---|---|
| 2024 | $3,528 | $49,550 | $7,480 | $42,070 |
| 2023 | $3,528 | $55,220 | $8,340 | $46,880 |
| 2022 | $2,469 | $35,880 | $4,070 | $31,810 |
| 2021 | $2,544 | $36,900 | $4,180 | $32,720 |
| 2020 | $2,109 | $31,440 | $4,180 | $27,260 |
| 2019 | $2,123 | $31,440 | $4,180 | $27,260 |
| 2018 | $2,035 | $29,400 | $3,240 | $26,160 |
| 2017 | $2,019 | $29,400 | $3,240 | $26,160 |
| 2016 | $1,802 | $26,680 | $2,870 | $23,810 |
| 2015 | $1,572 | $23,700 | $2,870 | $20,830 |
| 2014 | $1,331 | $21,470 | $2,870 | $18,600 |
Source: Public Records
Map
Nearby Homes
- 23855 Horsefly Rd
- 67864 and 67918 Wildcat Trail
- 171 County Road 22
- 22465 Horsefly Rd
- 255 Melody Ln
- 830 Tiyoweh Trail
- 1917 County Road 22
- 235 Cactus Place
- 22207 6840 Ct
- 68671 Vernal Rd
- 22130 6850 Rd Unit 210
- 22130 6850 Rd Unit 212
- 22130 6850 Rd Unit 210-215
- 22130 6850 Rd Unit 211
- 22130 6850 Rd Unit 214
- 22130 6850 Rd Unit 215
- 22130 6850 Rd Unit 213
- 2375 County Road 1
- 35 Hotchkiss Ave
- TBD Ute Valley Dr Unit Lot 1
- 23990 Horsefly Rd
- 23989 Horsefly Rd
- 24144 Horsefly Rd
- 24095 Horsefly Rd
- 24214 Horsefly Rd
- 23953 Horsefly Rd
- 24230 Horsefly Rd
- 24227 Horsefly Rd
- 0 Horsefly Unit 613438
- 0 Horsefly Unit 658634
- 0 Horsefly Unit 661336
- 0 Horsefly Unit 668944
- 0 Horsefly Unit 672211
- 0 Horsefly Unit 684343
- 0 Horsefly Unit 1 Mile South of Gov.
- 0 Horsefly
- 24125 Horsefly Rd
- 23835 Horsefly Rd
- 24115 Horsefly Rd
- 23820 Horsefly Rd