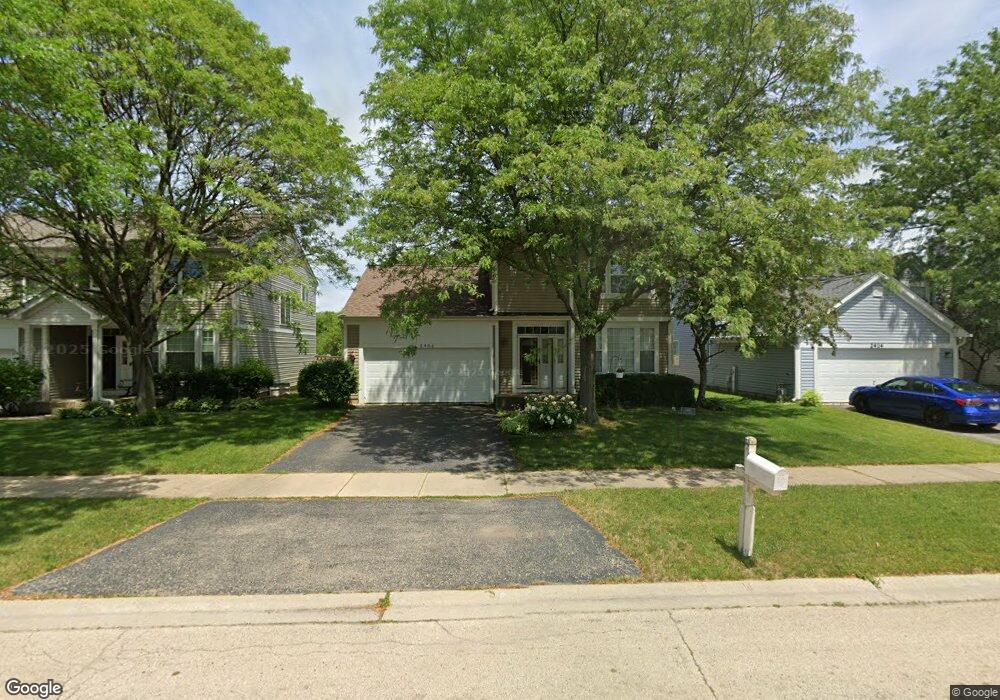
2406 Savoy Ct Unit 1A Aurora, IL 60503
Far Southeast NeighborhoodEstimated Value: $398,000 - $422,000
3
Beds
2
Baths
1,806
Sq Ft
$225/Sq Ft
Est. Value
About This Home
This home is located at 2406 Savoy Ct Unit 1A, Aurora, IL 60503 and is currently estimated at $405,451, approximately $224 per square foot. 2406 Savoy Ct Unit 1A is a home located in Will County with nearby schools including The Wheatlands Elementary School, Bednarcik Jr. High School, and Oswego East High School.
Ownership History
Date
Name
Owned For
Owner Type
Purchase Details
Closed on
Feb 21, 2011
Sold by
Fannie Mae
Bought by
Beresoff Patricia I and Beresoff Erik M
Current Estimated Value
Home Financials for this Owner
Home Financials are based on the most recent Mortgage that was taken out on this home.
Original Mortgage
$132,000
Outstanding Balance
$90,752
Interest Rate
4.88%
Mortgage Type
New Conventional
Estimated Equity
$314,699
Purchase Details
Closed on
Sep 15, 2010
Sold by
Grandison Lissa Llenos
Bought by
Federal National Mortgage Association
Purchase Details
Closed on
May 31, 2005
Sold by
Hurley Kenneth J and Hurley Christie L
Bought by
Grandison Lissa Llenos
Home Financials for this Owner
Home Financials are based on the most recent Mortgage that was taken out on this home.
Original Mortgage
$247,000
Interest Rate
5.82%
Mortgage Type
Fannie Mae Freddie Mac
Create a Home Valuation Report for This Property
The Home Valuation Report is an in-depth analysis detailing your home's value as well as a comparison with similar homes in the area
Home Values in the Area
Average Home Value in this Area
Purchase History
| Date | Buyer | Sale Price | Title Company |
|---|---|---|---|
| Beresoff Patricia I | $165,000 | Attorneys Title Guaranty Fun | |
| Federal National Mortgage Association | $247,000 | None Available | |
| Grandison Lissa Llenos | $247,000 | Chicago Title Insurance Comp |
Source: Public Records
Mortgage History
| Date | Status | Borrower | Loan Amount |
|---|---|---|---|
| Open | Beresoff Patricia I | $132,000 | |
| Previous Owner | Grandison Lissa Llenos | $247,000 |
Source: Public Records
Tax History
| Year | Tax Paid | Tax Assessment Tax Assessment Total Assessment is a certain percentage of the fair market value that is determined by local assessors to be the total taxable value of land and additions on the property. | Land | Improvement |
|---|---|---|---|---|
| 2024 | $8,338 | $103,658 | $30,881 | $72,777 |
| 2023 | $8,338 | $91,571 | $27,280 | $64,291 |
| 2022 | $8,339 | $83,799 | $25,805 | $57,994 |
| 2021 | $8,313 | $79,808 | $24,576 | $55,232 |
| 2020 | $7,967 | $78,544 | $24,187 | $54,357 |
| 2019 | $8,066 | $76,330 | $23,505 | $52,825 |
| 2018 | $7,374 | $67,397 | $22,988 | $44,409 |
| 2017 | $7,265 | $65,658 | $22,395 | $43,263 |
| 2016 | $7,294 | $64,245 | $21,913 | $42,332 |
| 2015 | $7,650 | $61,774 | $21,070 | $40,704 |
| 2014 | $7,650 | $59,640 | $21,070 | $38,570 |
| 2013 | $7,650 | $59,640 | $21,070 | $38,570 |
Source: Public Records
Map
Nearby Homes
- 1782 Montrose Dr
- 2465 Bristol Ct Unit 8B
- 2509 Rosehall Ln
- 1740 Cumberland Rd Unit 8B
- 1655 Trafalgar Ln
- 2484 Warwick Ct
- 2490 Ridge Ave
- 2632 Emma Cir
- 2509 Brook Ln
- 1734 Baler Ave
- 1737 Stable Ln
- 1722 Baler Ave
- 1721 Stable Ln
- 1691 Baler Ave
- 1697 Baler Ave
- 1728 Baler Ave
- 1703 Baler Ave
- 1716 Baler Ave
- 1727 Stable Ln
- 1709 Baler Ave
- 2414 Savoy Ct
- 2398 Savoy Ct
- 2422 Savoy Ct
- 2390 Savoy Ct
- 2382 Savoy Ct
- 2430 Savoy Ct
- 2407 Savoy Ct
- 2415 Savoy Ct
- 2460 Halsted Ln
- 2374 Savoy Ct
- 2438 Savoy Ct
- 2423 Savoy Ct
- 2454 Halsted Ln
- 2431 Savoy Ct
- 1738 Montrose Dr
- 2445 Bristol Ct Unit 8B
- 2446 Savoy Ct
- 2435 Bristol Ct Unit 8B
- 2404 Albany Ct
- 2425 Bristol Ct Unit 8B
Your Personal Tour Guide
Ask me questions while you tour the home.