Estimated Value: $155,000 - $205,926
2
Beds
1
Bath
640
Sq Ft
$282/Sq Ft
Est. Value
About This Home
This home is located at 24064 549th Ave, Osage, MN 56570 and is currently estimated at $180,232, approximately $281 per square foot. 24064 549th Ave is a home with nearby schools including Century Elementary School, Century School, and Park Rapids Area High School.
Ownership History
Date
Name
Owned For
Owner Type
Purchase Details
Closed on
Nov 17, 2017
Sold by
Rieck Family Llc
Bought by
Meyer Janell and Murray Jodie
Current Estimated Value
Purchase Details
Closed on
Mar 11, 2013
Sold by
Rieck Larry M and Rieck Janice M
Bought by
Rieck Family Llc
Purchase Details
Closed on
Aug 23, 2012
Sold by
Kolbinger Karen F and Offutt Marie T
Bought by
Rieck Larry M and Rieck Janice M
Purchase Details
Closed on
Apr 14, 2009
Sold by
Reinke Robert D
Bought by
Kolbinger Karen F and Lucero Marie T
Purchase Details
Closed on
Sep 9, 2008
Sold by
Kolbinger Karen F and Lucero Marie T
Bought by
Vancampen Sandra K and Reinke Robert D
Purchase Details
Closed on
Aug 29, 2008
Sold by
Vancampen Sandra K
Bought by
Kolbinger John S and Kolbinger Karen F
Purchase Details
Closed on
Aug 27, 2008
Sold by
Reinke Robert D
Bought by
Kolhinger John S and Kolhinger Karen F
Create a Home Valuation Report for This Property
The Home Valuation Report is an in-depth analysis detailing your home's value as well as a comparison with similar homes in the area
Purchase History
| Date | Buyer | Sale Price | Title Company |
|---|---|---|---|
| Meyer Janell | -- | None Available | |
| Rieck Family Llc | -- | None Available | |
| Rieck Larry M | $70,000 | None Available | |
| Kolbinger Karen F | -- | None Available | |
| Kolbinger Karen F | -- | None Available | |
| Vancampen Sandra K | -- | Bcts | |
| Kolbinger John S | -- | None Available | |
| Kolhinger John S | -- | None Available |
Source: Public Records
Tax History
| Year | Tax Paid | Tax Assessment Tax Assessment Total Assessment is a certain percentage of the fair market value that is determined by local assessors to be the total taxable value of land and additions on the property. | Land | Improvement |
|---|---|---|---|---|
| 2025 | $1,186 | $185,000 | $102,000 | $83,000 |
| 2024 | $1,104 | $166,000 | $92,900 | $73,100 |
| 2023 | $1,056 | $142,100 | $82,500 | $59,600 |
| 2022 | $1,014 | $118,400 | $80,500 | $37,900 |
| 2021 | $1,132 | $133,800 | $84,800 | $49,000 |
| 2020 | $1,166 | $133,800 | $84,800 | $49,000 |
| 2019 | $1,040 | $135,900 | $84,800 | $51,100 |
| 2018 | $1,052 | $120,900 | $84,800 | $36,100 |
| 2017 | $1,070 | $121,100 | $79,800 | $41,300 |
| 2016 | $978 | $117,400 | $79,800 | $37,600 |
| 2015 | $984 | $104,300 | $79,800 | $24,500 |
| 2014 | -- | $103,400 | $79,800 | $23,600 |
Source: Public Records
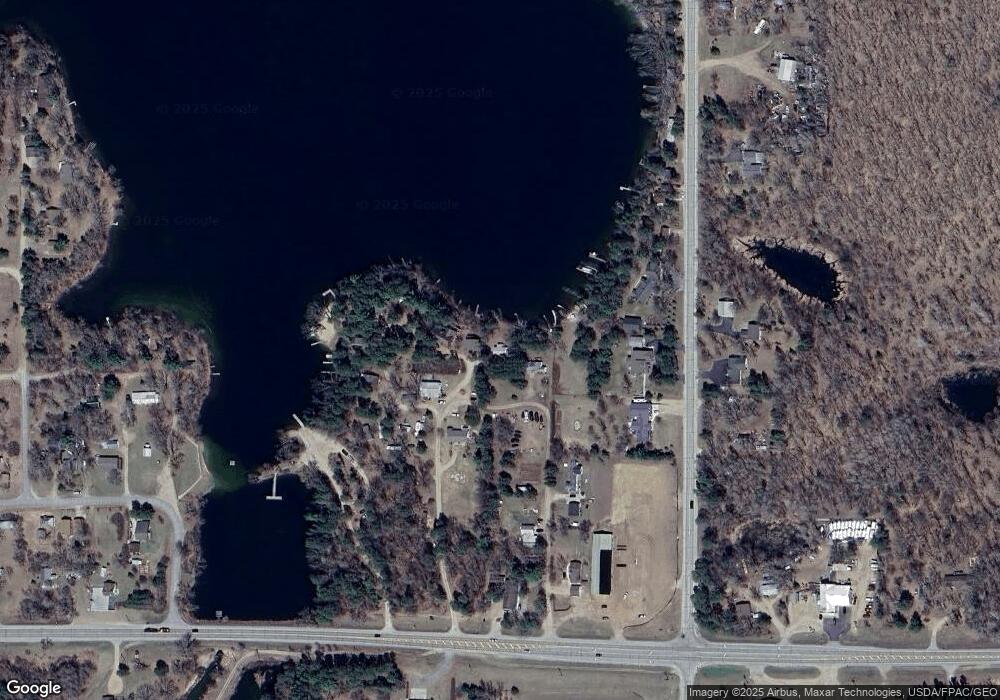
Map
Nearby Homes
- 24033 Pine Ave
- 54738 Sunset St
- TBD 10 Bog Lake Trail
- TBD 8 Bog Lake Trail
- tbd 550 Ave
- 19556 550th Ave
- TBD County Highway 47
- 28515 Fool's Lake Dr
- TBD Brush Lake Ln
- 11100 Fisher Ln
- 13737 109th Ave
- 16566 129th Ave
- 57897 175th St
- TBD County 14
- 13330 Ermine Dr
- 56202 White Pine Cir
- 31495 Two Inlets Dr
- 46840 Foss Rd
- 46824 Foss Rd
- 0 Tbd Bass Lake Rd Unit LotWP001
- 54852 State Highway 34
- 24112 County Highway 48
- 24140 County Highway 48
- 24162 County Highway 48
- 24210 County Highway 48
- 54906 State Highway 34
- 54958 State Highway 34
- 54958 State Highway 34
- 24141 County Highway 48
- 24185 County Highway 48
- 54870 State Highway 34
- 54870 Minnesota 34
- 24105 County Highway 48
- 24111 County Highway 48
- 54870
- 24241 County Highway 48
- xxx Holley St
- 24246 County Highway 48
- 24252 County Highway 48
- TBD County 48
Your Personal Tour Guide
Ask me questions while you tour the home.