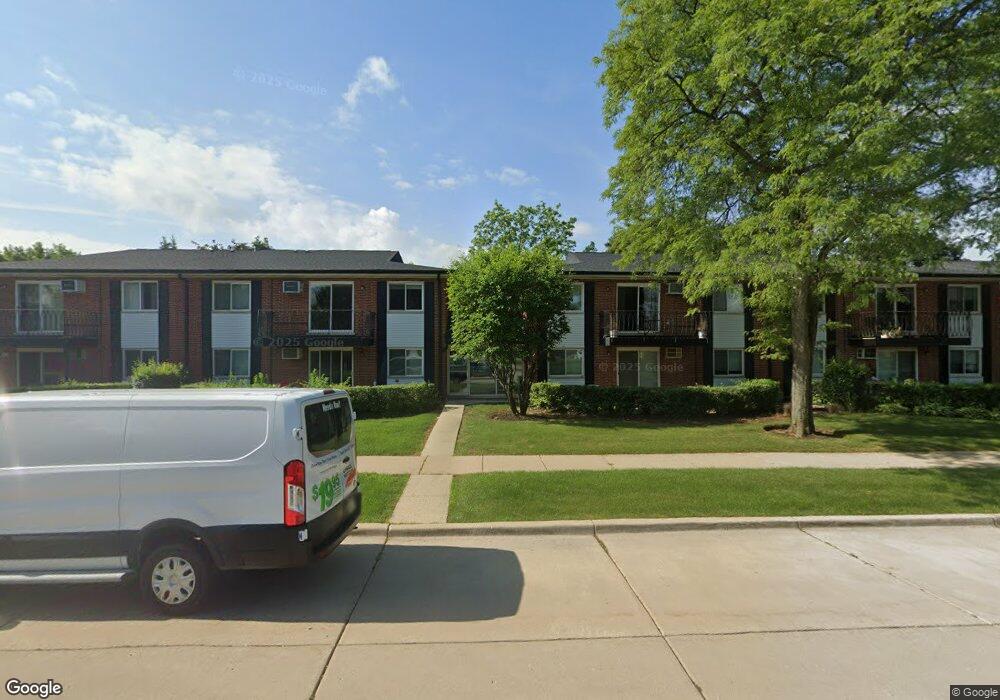
2407 E Olive St Unit 92G Arlington Heights, IL 60004
Estimated Value: $164,000 - $168,929
1
Bed
1
Bath
780
Sq Ft
$212/Sq Ft
Est. Value
About This Home
This home is located at 2407 E Olive St Unit 92G, Arlington Heights, IL 60004 and is currently estimated at $165,482, approximately $212 per square foot. 2407 E Olive St Unit 92G is a home located in Cook County with nearby schools including Dwight D Eisenhower Elementary School, Anne Sullivan Elementary School, and Betsy Ross Elementary School.
Ownership History
Date
Name
Owned For
Owner Type
Purchase Details
Closed on
Dec 24, 2009
Sold by
Lekarczyk Elzbieta and Kolber Lukasz
Bought by
Clune Mary Josephine
Current Estimated Value
Home Financials for this Owner
Home Financials are based on the most recent Mortgage that was taken out on this home.
Original Mortgage
$84,000
Outstanding Balance
$54,621
Interest Rate
4.84%
Mortgage Type
New Conventional
Estimated Equity
$110,861
Purchase Details
Closed on
Jun 1, 2004
Sold by
Sowa Wanda
Bought by
Sibiga Elzbieta
Home Financials for this Owner
Home Financials are based on the most recent Mortgage that was taken out on this home.
Original Mortgage
$108,450
Interest Rate
6.46%
Mortgage Type
Unknown
Purchase Details
Closed on
Jan 31, 2000
Sold by
Allen Michelle
Bought by
Sowa Wanda
Home Financials for this Owner
Home Financials are based on the most recent Mortgage that was taken out on this home.
Original Mortgage
$51,100
Interest Rate
12.25%
Create a Home Valuation Report for This Property
The Home Valuation Report is an in-depth analysis detailing your home's value as well as a comparison with similar homes in the area
Home Values in the Area
Average Home Value in this Area
Purchase History
| Date | Buyer | Sale Price | Title Company |
|---|---|---|---|
| Clune Mary Josephine | $107,500 | None Available | |
| Sibiga Elzbieta | $120,500 | Multiple | |
| Sowa Wanda | $73,000 | -- |
Source: Public Records
Mortgage History
| Date | Status | Borrower | Loan Amount |
|---|---|---|---|
| Open | Clune Mary Josephine | $84,000 | |
| Previous Owner | Sibiga Elzbieta | $108,450 | |
| Previous Owner | Sowa Wanda | $51,100 |
Source: Public Records
Tax History Compared to Growth
Tax History
| Year | Tax Paid | Tax Assessment Tax Assessment Total Assessment is a certain percentage of the fair market value that is determined by local assessors to be the total taxable value of land and additions on the property. | Land | Improvement |
|---|---|---|---|---|
| 2024 | $1,892 | $10,237 | $944 | $9,293 |
| 2023 | $1,779 | $10,237 | $944 | $9,293 |
| 2022 | $1,779 | $10,237 | $944 | $9,293 |
| 2021 | $1,611 | $5,299 | $295 | $5,004 |
| 2020 | $650 | $5,299 | $295 | $5,004 |
| 2019 | $662 | $5,931 | $295 | $5,636 |
| 2018 | $580 | $5,426 | $236 | $5,190 |
| 2017 | $591 | $5,426 | $236 | $5,190 |
| 2016 | $786 | $5,426 | $236 | $5,190 |
| 2015 | $609 | $4,672 | $590 | $4,082 |
| 2014 | $617 | $4,672 | $590 | $4,082 |
| 2013 | $586 | $4,672 | $590 | $4,082 |
Source: Public Records
Map
Nearby Homes
- 2315 E Olive St Unit 3G
- 2315 E Olive St Unit 2G
- 2424 E Oakton St Unit 3C
- 2420 E Brandenberry Ct Unit 4C
- 1215 N Waterman Ave Unit 3L
- 2403 E Brandenberry Ct Unit 2A
- 2431 E Brandenberry Ct Unit 2O
- 2443 E Brandenberry Ct Unit 2A
- 2443 E Brandenberry Ct Unit 1B
- 412 W Olive Ave
- 2611 E Radford Ct
- 1101 N Stratford Rd
- 1401 Plum Ct Unit D
- 1311 Nutmeg Ct Unit A
- 910 Persimmon Ln Unit A
- 802 Butternut Ln Unit C
- 802 Butternut Ln Unit D
- 1510 N Kendal Ct Unit 11510
- 1605 E Frederick St
- 1511 N Windsor Dr Unit 208
- 2407 E Olive St Unit 92F
- 2407 E Olive St Unit 92H
- 2407 E Olive St Unit 92E
- 2407 E Olive St Unit 91G
- 2407 E Olive St Unit 91F
- 2407 E Olive St Unit 91E
- 2407 E Olive St Unit 91H
- 2407 E Olive St Unit 2H
- 2407 E Olive St Unit 2G
- 2411 E Olive St Unit 2C
- 2411 E Olive St Unit 92C
- 2411 E Olive St Unit 92B
- 2411 E Olive St Unit 91B
- 2411 E Olive St Unit 92A
- 2411 E Olive St Unit 91D
- 2411 E Olive St Unit 92D
- 2411 E Olive St Unit 91C
- 2411 E Olive St Unit 91A
- 2411 E Olive St Unit 2A
- 2411 E Olive St Unit 1B