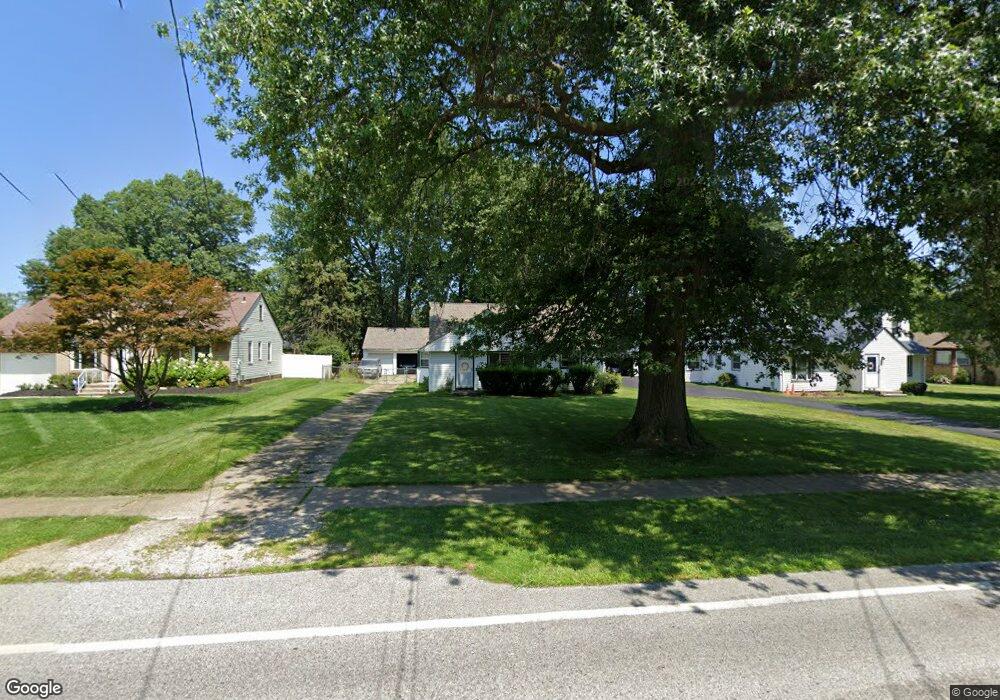
24072 Westwood Rd Westlake, OH 44145
Estimated Value: $250,000 - $285,000
3
Beds
2
Baths
1,331
Sq Ft
$197/Sq Ft
Est. Value
About This Home
This home is located at 24072 Westwood Rd, Westlake, OH 44145 and is currently estimated at $262,504, approximately $197 per square foot. 24072 Westwood Rd is a home located in Cuyahoga County with nearby schools including Dover Intermediate School, Lee Burneson Middle School, and Westlake High School.
Ownership History
Date
Name
Owned For
Owner Type
Purchase Details
Closed on
Jul 3, 2008
Sold by
Johnson Marilyn C
Bought by
Johnson Charles E
Current Estimated Value
Home Financials for this Owner
Home Financials are based on the most recent Mortgage that was taken out on this home.
Original Mortgage
$79,000
Interest Rate
3.6%
Mortgage Type
New Conventional
Purchase Details
Closed on
Oct 5, 1994
Sold by
Reed Thomas R
Bought by
Johnson Charles E and Johnson Marilyn C
Home Financials for this Owner
Home Financials are based on the most recent Mortgage that was taken out on this home.
Original Mortgage
$47,700
Interest Rate
7.87%
Mortgage Type
New Conventional
Purchase Details
Closed on
Jun 13, 1986
Sold by
Phan Zoltan and Phan Marjorie
Bought by
Reed Thomas R
Purchase Details
Closed on
Aug 14, 1985
Sold by
Phan Zoltan and Phan Marjorie
Bought by
Phan Zoltan and Phan Marjorie
Purchase Details
Closed on
Jan 1, 1975
Bought by
Phan Zoltan and Phan Marjorie
Create a Home Valuation Report for This Property
The Home Valuation Report is an in-depth analysis detailing your home's value as well as a comparison with similar homes in the area
Home Values in the Area
Average Home Value in this Area
Purchase History
| Date | Buyer | Sale Price | Title Company |
|---|---|---|---|
| Johnson Charles E | -- | Attorney | |
| Johnson Charles E | $102,000 | -- | |
| Reed Thomas R | $67,500 | -- | |
| Phan Zoltan | -- | -- | |
| Phan Zoltan | -- | -- |
Source: Public Records
Mortgage History
| Date | Status | Borrower | Loan Amount |
|---|---|---|---|
| Closed | Johnson Charles E | $79,000 | |
| Closed | Johnson Charles E | $47,700 |
Source: Public Records
Tax History Compared to Growth
Tax History
| Year | Tax Paid | Tax Assessment Tax Assessment Total Assessment is a certain percentage of the fair market value that is determined by local assessors to be the total taxable value of land and additions on the property. | Land | Improvement |
|---|---|---|---|---|
| 2024 | $3,508 | $72,940 | $17,360 | $55,580 |
| 2023 | $3,064 | $55,300 | $14,770 | $40,530 |
| 2022 | $3,015 | $55,300 | $14,770 | $40,530 |
| 2021 | $3,019 | $55,300 | $14,770 | $40,530 |
| 2020 | $2,861 | $47,290 | $12,640 | $34,650 |
| 2019 | $3,315 | $164,100 | $36,100 | $128,000 |
| 2018 | $3,108 | $57,440 | $12,640 | $44,800 |
| 2017 | $2,917 | $47,330 | $9,840 | $37,490 |
| 2016 | $2,901 | $47,330 | $9,840 | $37,490 |
| 2015 | $2,886 | $47,330 | $9,840 | $37,490 |
| 2014 | $2,870 | $45,960 | $9,560 | $36,400 |
Source: Public Records
Map
Nearby Homes
- 24225 Stonehedge Dr
- 24217 Vincent Dr
- 24336 Smith Ave
- 24363 Smith Ave
- 23547 Quail Hollow
- 2375 Clague Rd
- 24407 Westwood Rd
- 23225 Marion Rd
- 23181 Marion Rd
- 24500 Westwood Rd
- 23205 Clifford Dr
- 2045 Clague Rd
- 24502 Cornerstone
- 23045 Clifford Dr
- 23240 Pheasant Ln Unit 7
- 1874 Donna Dr
- 23575 Carriage Ln
- 1851 King James Pkwy Unit 114
- 22788 Vine Ct
- 24757 Meadow Ln
- 24052 Westwood Rd
- 24112 Westwood Rd
- 24036 Westwood Rd
- 24132 Westwood Rd
- 24024 Westwood Rd
- 24152 Westwood Rd
- 23987 Smith Ave
- 23987 Westwood Rd
- 23991 Westwood Rd
- 23955 Smith Ave
- 24015 Smith Ave
- 24010 Westwood Rd
- 23947 Smith Ave
- 23995 Westwood Rd
- 24065 Smith Ave
- 23921 Smith Ave
- 23971 Westwood Rd
- 23969 Smith Ave
- 23990 Westwood Rd
- 23921 Westwood Rd