
Landlord's Agent in 2024
John Firnhaber
Property Management Of Texas
(512) 748-4002
8 in this area
16 Total Sales
Estimated Value: $241,000
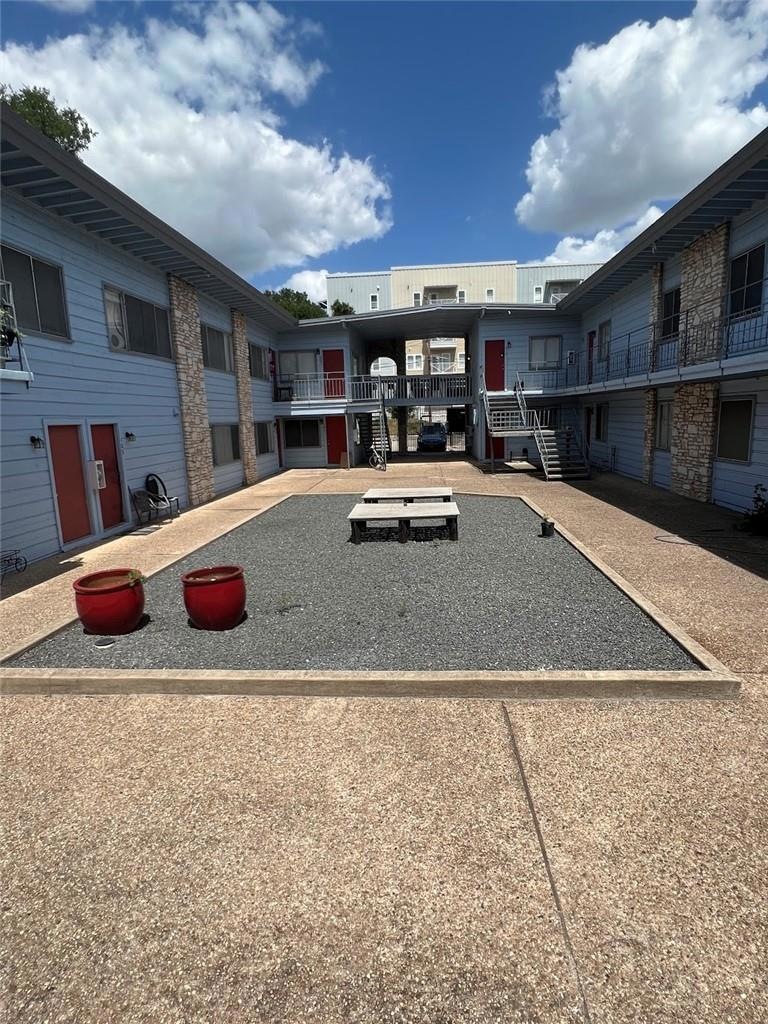
GREAT 2-1...WASHER DRYER.. SUPER AFFORDABLE SUPER NICE WEST CAMPUS TWO BEDROOM ONE BATH AT STAR WEST. LAMINATE WOOD FLOORS THROUGH OUT. ELEGANTLY REMODELED BATH. FULL SIZE STACK WASHER /DRYER. GATED ENTRY AND RESERVED PARKING. TRASH, AND GAS ARE PAID. 8 BLOCKS TO THE UT CAMPUS. 2 BLOCKS TO THE WEST CAMPUS SHUTTLE. TWO BLOCKS TO FRESH PLUS GROCERY
Last Agent to Rent the Property
Property Management Of Texas Brokerage Phone: (512) 476-2673 License #0322920 Listed on: 02/03/2024
| Date | Buyer | Sale Price | Title Company |
|---|---|---|---|
| Piney House Ltd Partnership | -- | -- |
| Date | Status | Borrower | Loan Amount |
|---|---|---|---|
| Closed | Piney House Ltd Partnership | $62,400 |
| Date | Event | Price | List to Sale | Price per Sq Ft |
|---|---|---|---|---|
| 08/01/2024 08/01/24 | Rented | $1,300 | 0.0% | -- |
| 07/17/2024 07/17/24 | Price Changed | $1,300 | -7.1% | $2 / Sq Ft |
| 07/02/2024 07/02/24 | Price Changed | $1,400 | -6.7% | $2 / Sq Ft |
| 06/04/2024 06/04/24 | Price Changed | $1,500 | -11.8% | $2 / Sq Ft |
| 02/03/2024 02/03/24 | For Rent | $1,700 | +7.6% | -- |
| 06/08/2022 06/08/22 | Rented | $1,580 | 0.0% | -- |
| 06/07/2022 06/07/22 | Under Contract | -- | -- | -- |
| 05/25/2022 05/25/22 | For Rent | $1,580 | +31.7% | -- |
| 08/01/2021 08/01/21 | Rented | $1,200 | 0.0% | -- |
| 06/21/2021 06/21/21 | Under Contract | -- | -- | -- |
| 04/23/2021 04/23/21 | Price Changed | $1,200 | +33.3% | $2 / Sq Ft |
| 01/07/2021 01/07/21 | Price Changed | $900 | -5.3% | $1 / Sq Ft |
| 12/29/2020 12/29/20 | Price Changed | $950 | -5.0% | $1 / Sq Ft |
| 12/29/2020 12/29/20 | Price Changed | $1,000 | -16.7% | $1 / Sq Ft |
| 12/08/2020 12/08/20 | For Rent | $1,200 | -17.2% | -- |
| 03/15/2019 03/15/19 | Rented | $1,450 | 0.0% | -- |
| 02/05/2019 02/05/19 | Under Contract | -- | -- | -- |
| 01/19/2019 01/19/19 | Price Changed | $1,450 | 0.0% | $2 / Sq Ft |
| 01/19/2019 01/19/19 | For Rent | $1,450 | +3.6% | -- |
| 01/19/2019 01/19/19 | Price Changed | $1,400 | +47.4% | $2 / Sq Ft |
| 01/12/2019 01/12/19 | Under Contract | -- | -- | -- |
| 12/18/2018 12/18/18 | Price Changed | $950 | +5.6% | $1 / Sq Ft |
| 12/18/2018 12/18/18 | Price Changed | $900 | -37.9% | $1 / Sq Ft |
| 11/24/2018 11/24/18 | For Rent | $1,450 | -- | -- |
| Year | Tax Paid | Tax Assessment Tax Assessment Total Assessment is a certain percentage of the fair market value that is determined by local assessors to be the total taxable value of land and additions on the property. | Land | Improvement |
|---|---|---|---|---|
| 2025 | $5,015 | $245,054 | $135,000 | $110,054 |
| 2023 | $5,789 | $319,978 | $135,000 | $184,978 |
| 2022 | $5,358 | $271,326 | $68,400 | $202,926 |
| 2021 | $5,140 | $236,143 | $68,400 | $167,743 |
| 2020 | $4,950 | $230,800 | $68,400 | $162,400 |
| 2018 | $5,045 | $227,876 | $684 | $227,192 |
| 2017 | $4,349 | $195,000 | $684 | $194,316 |
| 2016 | $3,692 | $165,539 | $68,400 | $97,139 |
| 2015 | $3,421 | $153,701 | $684 | $153,017 |
| 2014 | $3,421 | $147,812 | $684 | $147,128 |
Landlord's Agent in 2024
John Firnhaber
Property Management Of Texas
(512) 748-4002
8 in this area
16 Total Sales
B
Tenant's Agent in 2024
Bill Bostick
Property Management Of Texas
(512) 775-2850
2 in this area
3 Total Sales
Buyer's Agent in 2019
Melanie Boone
ERA Experts
(512) 431-9840
29 Total Sales
Source: Unlock MLS (Austin Board of REALTORS®)
MLS Number: 9212470
APN: 206158
Disclaimer: Certain information contained herein is derived from information provided by parties other than Homes.com. All information provided is deemed reliable, but is not guaranteed to be accurate and should be independently verified.
![]() Based on information from the Austin Board of REALTORS® (alternatively, from ACTRIS). Neither the Board nor ACTRIS guarantees or is in any way responsible for its accuracy. All data is provided “AS IS” and with all faults. Data maintained by the Board or ACTRIS may not reflect all real estate activity in the market.
Based on information from the Austin Board of REALTORS® (alternatively, from ACTRIS). Neither the Board nor ACTRIS guarantees or is in any way responsible for its accuracy. All data is provided “AS IS” and with all faults. Data maintained by the Board or ACTRIS may not reflect all real estate activity in the market.
Information being provided is for consumers’ personal, non-commercial use and may not be used for any purpose other than to identify prospective properties consumers may be interested in purchasing. All data is obtained from various sources and may not have been verified by broker or MLS GRID. Supplied Open House Information is subject to change without notice. All information should be independently reviewed and verified for accuracy. Properties may or may not be listed by the office/agent presenting the information. Some IDX listings have been excluded from this website.
Based on information submitted to the MLS GRID
Ask me questions while you tour the home.