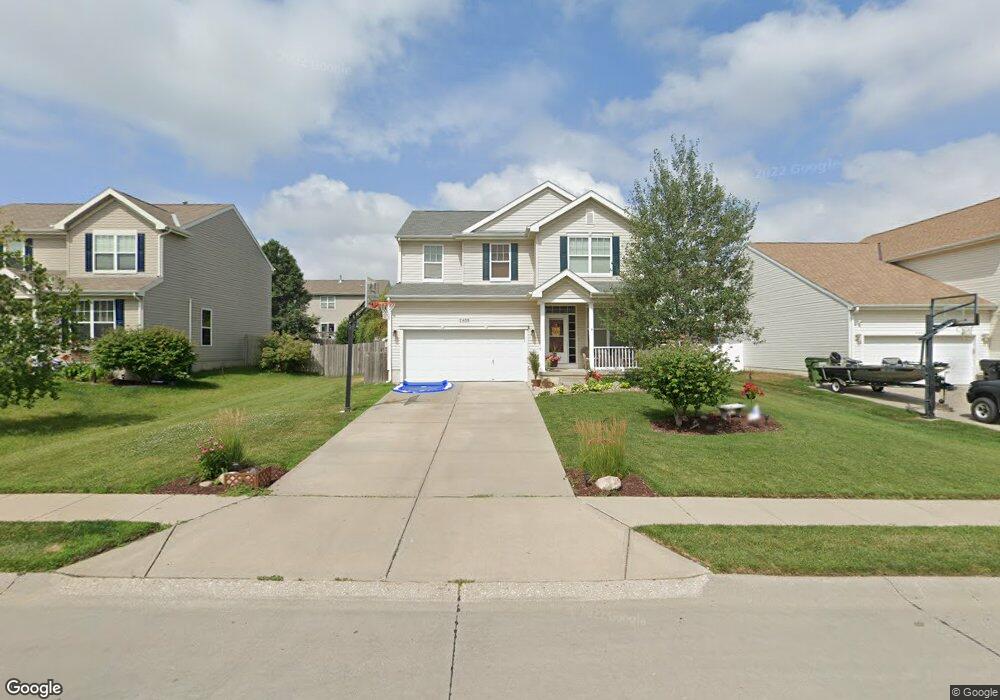
2408 S Mineral Dr Papillion, NE 68046
Estimated Value: $349,313 - $383,000
4
Beds
4
Baths
2,284
Sq Ft
$159/Sq Ft
Est. Value
About This Home
This home is located at 2408 S Mineral Dr, Papillion, NE 68046 and is currently estimated at $362,078, approximately $158 per square foot. 2408 S Mineral Dr is a home located in Sarpy County with nearby schools including Patriot Elementary School, Liberty Middle School, and Papillion La Vista South High School.
Ownership History
Date
Name
Owned For
Owner Type
Purchase Details
Closed on
Nov 11, 2011
Sold by
Dyer William Pete and Dyer Sarah M
Bought by
Bonham Matthew R and Bonham Jennifer
Current Estimated Value
Home Financials for this Owner
Home Financials are based on the most recent Mortgage that was taken out on this home.
Original Mortgage
$161,600
Outstanding Balance
$108,749
Interest Rate
3.75%
Mortgage Type
FHA
Estimated Equity
$253,329
Purchase Details
Closed on
Mar 7, 2008
Sold by
Bridges Larry J and Bridges Kelly D
Bought by
Dyer William Pete and Dyer Sarah M
Home Financials for this Owner
Home Financials are based on the most recent Mortgage that was taken out on this home.
Original Mortgage
$160,375
Interest Rate
5.72%
Purchase Details
Closed on
Mar 21, 2007
Sold by
Hearthstone Homes Inc
Bought by
Bridges Larry J and Bridges Kelly D
Home Financials for this Owner
Home Financials are based on the most recent Mortgage that was taken out on this home.
Original Mortgage
$151,163
Interest Rate
6.26%
Create a Home Valuation Report for This Property
The Home Valuation Report is an in-depth analysis detailing your home's value as well as a comparison with similar homes in the area
Home Values in the Area
Average Home Value in this Area
Purchase History
| Date | Buyer | Sale Price | Title Company |
|---|---|---|---|
| Bonham Matthew R | $175,000 | Omaha Title & Escrow Inc | |
| Dyer William Pete | $157,000 | Nlta | |
| Bridges Larry J | $152,000 | Slt |
Source: Public Records
Mortgage History
| Date | Status | Borrower | Loan Amount |
|---|---|---|---|
| Open | Bonham Matthew R | $161,600 | |
| Closed | Dyer William Pete | $160,375 | |
| Previous Owner | Bridges Larry J | $151,163 |
Source: Public Records
Tax History Compared to Growth
Tax History
| Year | Tax Paid | Tax Assessment Tax Assessment Total Assessment is a certain percentage of the fair market value that is determined by local assessors to be the total taxable value of land and additions on the property. | Land | Improvement |
|---|---|---|---|---|
| 2025 | $4,939 | $292,192 | $54,000 | $238,192 |
| 2024 | $5,458 | $285,158 | $50,000 | $235,158 |
| 2023 | $5,458 | $261,215 | $47,000 | $214,215 |
| 2022 | $5,313 | $233,123 | $42,000 | $191,123 |
| 2021 | $5,005 | $214,024 | $39,000 | $175,024 |
| 2020 | $4,841 | $207,299 | $36,000 | $171,299 |
| 2019 | $4,635 | $200,599 | $34,000 | $166,599 |
| 2018 | $4,541 | $194,158 | $32,000 | $162,158 |
| 2017 | $4,395 | $188,144 | $32,000 | $156,144 |
| 2016 | $4,263 | $180,791 | $25,000 | $155,791 |
| 2015 | $4,275 | $175,572 | $25,000 | $150,572 |
| 2014 | $4,091 | $167,484 | $25,000 | $142,484 |
| 2012 | -- | $164,166 | $25,000 | $139,166 |
Source: Public Records
Map
Nearby Homes
- 2208 S Mineral Dr
- 2110 S Mineral Dr
- 8904 Legacy St
- Lot 115 Ave Unit Lot 115
- 2010 Ridgeview Dr
- 8810 Legacy St
- 2105 Petersen Dr
- 8811 Legacy St
- 8716 Legacy St
- 8717 Legacy St Unit Lot 71
- 8713 Legacy St Unit Lot 70
- 12409 S 89th Ave Unit Lot 50
- 12524 S 89th Ave Unit Lot 102
- 12354 S 89th Ave Unit Lot 117
- 12516 S 89th Ave Unit Lot 104
- 12508 S 89th Ave Unit Lot 106
- 12314 S 89th Ave Unit Lot 119
- 12418 S 89th Ave Unit Lot 110
- 12426 S 89th Ave Unit Lot 108
- 12405 S 89th Ave Unit Lot 51
- 2406 S Mineral Dr
- 2410 S Mineral Dr
- 2407 Quartz Dr
- 2412 S Mineral Dr
- 2405 Quartz Dr
- 2404 S Mineral Dr
- 2409 S Mineral Dr
- 2407 S Mineral Dr
- 2411 Quartz Dr
- 2403 Quartz Dr
- 2411 S Mineral Dr
- 2405 S Mineral Dr
- 2414 S Mineral Dr
- 2413 Quartz Dr
- 2403 S Mineral Dr
- 2314 S Mineral Dr
- 2416 S Mineral Dr
- 2415 S Mineral Dr
- 2408 Quartz Dr
- 2408 S River Rock Dr