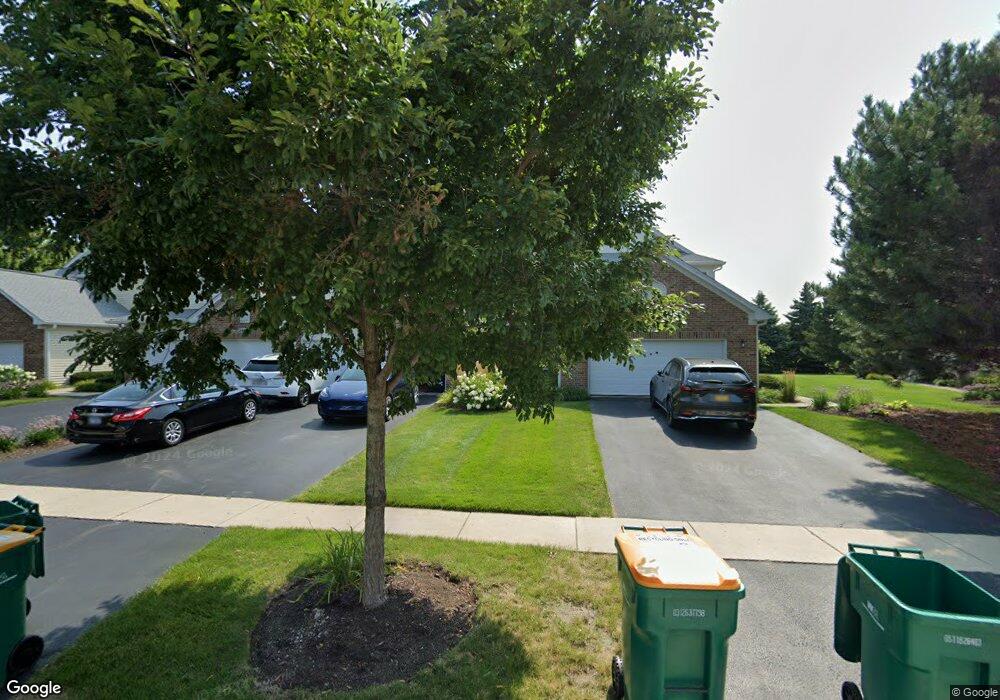
24087 Pear Tree Cir Unit 170604 Plainfield, IL 60585
North Plainfield NeighborhoodEstimated Value: $249,671 - $311,000
--
Bed
1
Bath
1,123
Sq Ft
$245/Sq Ft
Est. Value
About This Home
This home is located at 24087 Pear Tree Cir Unit 170604, Plainfield, IL 60585 and is currently estimated at $275,668, approximately $245 per square foot. 24087 Pear Tree Cir Unit 170604 is a home located in Will County with nearby schools including Eagle Pointe Elementary School, Heritage Grove Middle School, and Plainfield North High School.
Ownership History
Date
Name
Owned For
Owner Type
Purchase Details
Closed on
May 20, 2019
Sold by
Baccelli Cherise A and Rigtono Cherise
Bought by
Rigitono Cherise
Current Estimated Value
Home Financials for this Owner
Home Financials are based on the most recent Mortgage that was taken out on this home.
Original Mortgage
$124,800
Outstanding Balance
$95,659
Interest Rate
4.1%
Mortgage Type
New Conventional
Estimated Equity
$180,009
Purchase Details
Closed on
Jun 1, 2000
Sold by
Suburban Bank & Trust Company
Bought by
Baccelli Cherise A
Home Financials for this Owner
Home Financials are based on the most recent Mortgage that was taken out on this home.
Original Mortgage
$106,750
Interest Rate
8.56%
Create a Home Valuation Report for This Property
The Home Valuation Report is an in-depth analysis detailing your home's value as well as a comparison with similar homes in the area
Home Values in the Area
Average Home Value in this Area
Purchase History
| Date | Buyer | Sale Price | Title Company |
|---|---|---|---|
| Rigitono Cherise | -- | National Title Solutions Inc | |
| Baccelli Cherise A | $119,000 | Chicago Title Insurance Co |
Source: Public Records
Mortgage History
| Date | Status | Borrower | Loan Amount |
|---|---|---|---|
| Open | Rigitono Cherise | $124,800 | |
| Previous Owner | Baccelli Cherise A | $106,750 |
Source: Public Records
Tax History Compared to Growth
Tax History
| Year | Tax Paid | Tax Assessment Tax Assessment Total Assessment is a certain percentage of the fair market value that is determined by local assessors to be the total taxable value of land and additions on the property. | Land | Improvement |
|---|---|---|---|---|
| 2024 | $4,204 | $65,765 | $17,792 | $47,973 |
| 2023 | $4,204 | $58,096 | $15,717 | $42,379 |
| 2022 | $3,483 | $49,455 | $14,868 | $34,587 |
| 2021 | $3,313 | $47,100 | $14,160 | $32,940 |
| 2020 | $3,305 | $46,354 | $13,936 | $32,418 |
| 2019 | $3,245 | $45,047 | $13,543 | $31,504 |
| 2018 | $3,284 | $44,726 | $13,246 | $31,480 |
| 2017 | $3,262 | $43,294 | $12,904 | $30,390 |
| 2016 | $3,262 | $42,362 | $12,626 | $29,736 |
| 2015 | $3,612 | $40,732 | $12,140 | $28,592 |
| 2014 | $3,612 | $44,221 | $12,140 | $32,081 |
| 2013 | $3,612 | $44,221 | $12,140 | $32,081 |
Source: Public Records
Map
Nearby Homes
- 24115 Pear Tree Cir Unit 170807
- 24181 Pear Tree Cir Unit 171206
- 12906 S Slate Ln
- 12929 S Platte Trail
- 23236 W Teton Ln
- 24328 Whispering Trails Dr
- 24333 Leski Ln
- 2711 Lawlor Ln
- 2668 Lawlor Ln
- 2739 Lawlor Ln
- 5943 Polo St
- 5907 Polo St
- 5919 Polo St
- 5911 Polo St
- 11723 Heritage Meadows Dr
- 2547 Tailshot Rd
- 2611 Lawlor Ln
- 2607 Lawlor Ln
- 2547 Mallet Ct
- 2543 Mallet Ct
- 24085 Pear Tree Cir Unit 170605
- 24093 Pear Tree Cir Unit 170601
- 24089 Pear Tree Cir Unit 170603
- 24087 Pear Tree Cir Unit 2408
- 24091 Pear Tree Cir Unit 170602
- 24091 Pear Tree Cir Unit 91
- 24083 Pear Tree Cir Unit 170606
- 24077 Pear Tree Cir Unit 170501
- 24075 Pear Tree Cir Unit 170502
- 24067 Pear Tree Cir Unit 170506
- 24069 Pear Tree Cir Unit 170505
- 24071 Pear Tree Cir Unit 170504
- 24073 Pear Tree Cir Unit 170503
- 24077 Pear Tree Cir Unit 2407
- 24099 Pear Tree Cir Unit 170706
- 24107 Pear Tree Cir Unit 170705
- 24105 Pear Tree Cir
- 24101 Pear Tree Cir Unit 170705
- 24103 Pear Tree Cir Unit 170704
- 24107 Pear Tree Cir Unit 107