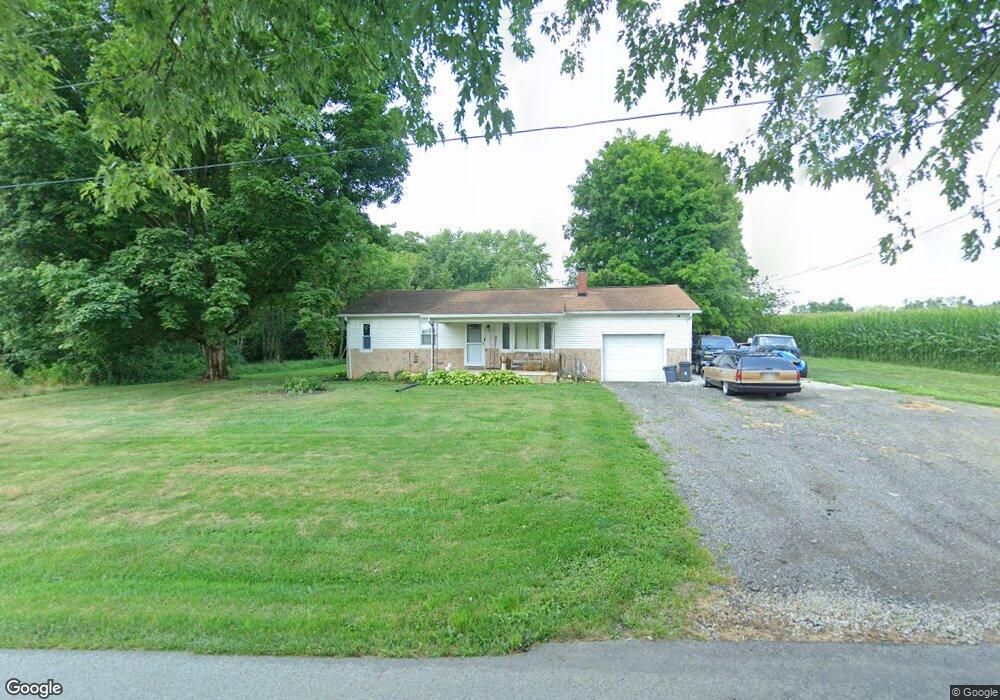
2409 Old Millersport Rd NE Lancaster, OH 43130
Estimated Value: $241,000 - $319,000
3
Beds
2
Baths
1,440
Sq Ft
$189/Sq Ft
Est. Value
About This Home
This home is located at 2409 Old Millersport Rd NE, Lancaster, OH 43130 and is currently estimated at $271,994, approximately $188 per square foot. 2409 Old Millersport Rd NE is a home located in Fairfield County with nearby schools including Medill Elementary School, Thomas Ewing Junior High School, and Lancaster High School.
Ownership History
Date
Name
Owned For
Owner Type
Purchase Details
Closed on
Oct 26, 2021
Sold by
Noice Freda May
Bought by
Noice Cody and Noice Elizabeth Grace
Current Estimated Value
Home Financials for this Owner
Home Financials are based on the most recent Mortgage that was taken out on this home.
Original Mortgage
$129,600
Outstanding Balance
$118,439
Interest Rate
2.8%
Mortgage Type
New Conventional
Estimated Equity
$153,555
Purchase Details
Closed on
Oct 19, 2021
Sold by
Noice Freda and Noice Freda May
Bought by
Noice Cody and Noice Elizabeth Grace
Home Financials for this Owner
Home Financials are based on the most recent Mortgage that was taken out on this home.
Original Mortgage
$129,600
Outstanding Balance
$118,439
Interest Rate
2.8%
Mortgage Type
New Conventional
Estimated Equity
$153,555
Purchase Details
Closed on
Jul 2, 2020
Sold by
Estate Of Harold E Noice
Bought by
Noice Freda
Create a Home Valuation Report for This Property
The Home Valuation Report is an in-depth analysis detailing your home's value as well as a comparison with similar homes in the area
Home Values in the Area
Average Home Value in this Area
Purchase History
| Date | Buyer | Sale Price | Title Company |
|---|---|---|---|
| Noice Cody | -- | None Listed On Document | |
| Noice Cody | $162,000 | Timios Inc | |
| Noice Freda | -- | None Available |
Source: Public Records
Mortgage History
| Date | Status | Borrower | Loan Amount |
|---|---|---|---|
| Open | Noice Cody | $129,600 | |
| Closed | Noice Cody | $129,600 |
Source: Public Records
Tax History Compared to Growth
Tax History
| Year | Tax Paid | Tax Assessment Tax Assessment Total Assessment is a certain percentage of the fair market value that is determined by local assessors to be the total taxable value of land and additions on the property. | Land | Improvement |
|---|---|---|---|---|
| 2024 | $4,996 | $51,450 | $11,800 | $39,650 |
| 2023 | $2,069 | $51,450 | $11,800 | $39,650 |
| 2022 | $2,094 | $51,450 | $11,800 | $39,650 |
| 2021 | $1,321 | $40,320 | $10,730 | $29,590 |
| 2020 | $785 | $40,320 | $10,730 | $29,590 |
| 2019 | $1,212 | $40,320 | $10,730 | $29,590 |
| 2018 | $407 | $33,840 | $10,730 | $23,110 |
| 2017 | $1,020 | $33,840 | $10,730 | $23,110 |
| 2016 | $945 | $33,840 | $10,730 | $23,110 |
| 2015 | $934 | $32,790 | $10,730 | $22,060 |
| 2014 | $891 | $32,790 | $10,730 | $22,060 |
| 2013 | $891 | $32,790 | $10,730 | $22,060 |
Source: Public Records
Map
Nearby Homes
- 2444 Sheridan Dr
- 0 Old Millersport Rd NE Unit Lot 10 225033491
- 0 Old Millersport Rd NE Unit 225010386
- 0 Old Millersport Rd NE Unit Tract 8 224028101
- 1760 Rainbow Dr NE
- 0 Lucille Dr NE
- 1669 Lexington Dr
- 3155 Old Millersport Rd NE
- 3155 Old Millersport Rd NE Unit Lot 11
- 1750 Coonpath Rd NE Unit Tract 5
- 2961 Old Millersport Rd NE
- 2149 Pleasantview Dr NE
- 0 Tschopp Rd NE Unit Lot 33 225027324
- 0 Tschopp Rd NE Unit Lot 17 225027320
- 1799 Declaration Dr W
- 1700 Rosewood Dr NE
- 0 Declaration Dr W Unit 219044159
- 980 Coonpath Rd NE
- 1801 Pleasantview Dr NE
- 2655 Lancaster Thornville Rd NE
- 2505 Sheridan Dr
- 2504 Sheridan Dr
- 2460 Old Millersport Rd NE
- 2419 Malibu Ave
- 2485 Sheridan Dr
- 2427 Malibu Ave
- 2486 Sheridan Dr
- 2435 Malibu Ave
- 2487 Seville St
- 2475 Sheridan Dr
- 2479 Seville St
- 2443 Malibu Ave
- 2465 Sheridan Dr
- 2468 Sheridan Dr
- 2471 Seville St
- 2488 Seville St
- 2453 Malibu Ave
- 000 Malibu
- 0 Malibu Ave Unit 9920111
- 0 Malibu Ave Unit 9920114