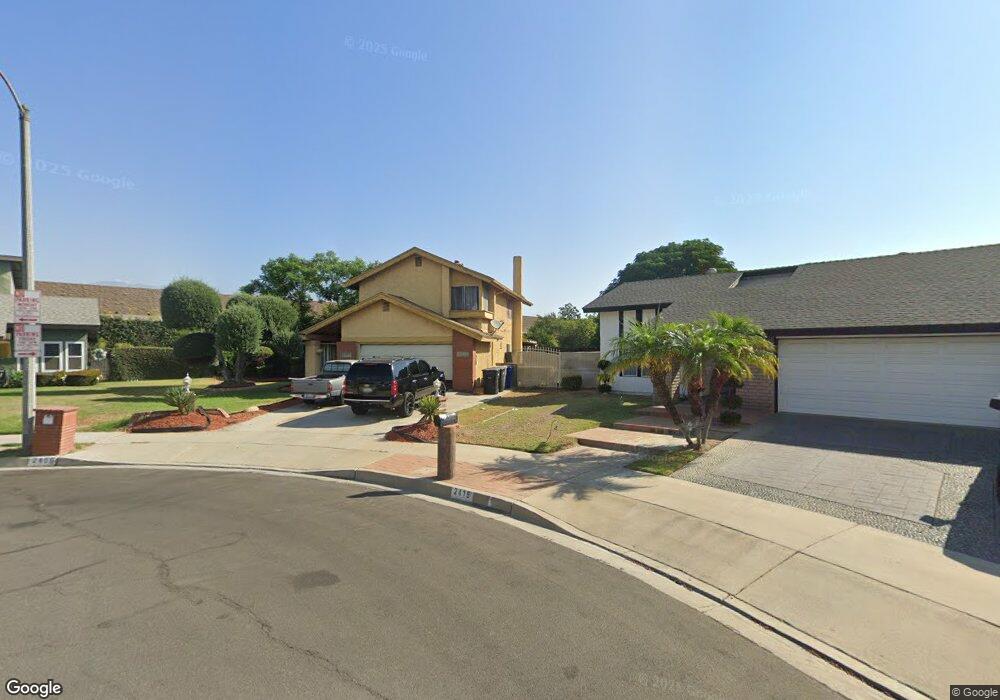
2409 S Phoenix Place Ontario, CA 91761
Downtown Ontario NeighborhoodEstimated Value: $747,244 - $792,000
4
Beds
2
Baths
1,808
Sq Ft
$424/Sq Ft
Est. Value
About This Home
This home is located at 2409 S Phoenix Place, Ontario, CA 91761 and is currently estimated at $767,061, approximately $424 per square foot. 2409 S Phoenix Place is a home located in San Bernardino County with nearby schools including Bon View Elementary, De Anza Middle, and Ontario High School.
Ownership History
Date
Name
Owned For
Owner Type
Purchase Details
Closed on
Jan 12, 2000
Sold by
Arteaga Jose Luis
Bought by
Jefferson Steven and Jefferson Patricia
Current Estimated Value
Home Financials for this Owner
Home Financials are based on the most recent Mortgage that was taken out on this home.
Original Mortgage
$152,379
Outstanding Balance
$48,706
Interest Rate
7.92%
Estimated Equity
$718,355
Purchase Details
Closed on
Aug 6, 1996
Sold by
Federal Home Loan Mortgage Corporation
Bought by
Arteaga Jose Luis
Home Financials for this Owner
Home Financials are based on the most recent Mortgage that was taken out on this home.
Original Mortgage
$120,300
Interest Rate
8.33%
Mortgage Type
FHA
Purchase Details
Closed on
Jun 26, 1996
Sold by
Arteaga Yadira
Bought by
Arteaga Jose L
Home Financials for this Owner
Home Financials are based on the most recent Mortgage that was taken out on this home.
Original Mortgage
$120,300
Interest Rate
8.33%
Mortgage Type
FHA
Purchase Details
Closed on
Oct 3, 1995
Sold by
Household Bank Fsb
Bought by
Federal Home Loan Mortgage Corporation
Purchase Details
Closed on
Jul 26, 1995
Sold by
Ixta Jaime
Bought by
Household Bank Fsb
Create a Home Valuation Report for This Property
The Home Valuation Report is an in-depth analysis detailing your home's value as well as a comparison with similar homes in the area
Home Values in the Area
Average Home Value in this Area
Purchase History
| Date | Buyer | Sale Price | Title Company |
|---|---|---|---|
| Jefferson Steven | $169,500 | Fidelity National Title Ins | |
| Arteaga Jose Luis | $100,000 | Fidelity National Title | |
| Arteaga Jose L | -- | Fidelity National Title Co | |
| Federal Home Loan Mortgage Corporation | -- | First Southwestern Title Co | |
| Household Bank Fsb | $146,024 | First Southwestern Title Co |
Source: Public Records
Mortgage History
| Date | Status | Borrower | Loan Amount |
|---|---|---|---|
| Open | Jefferson Steven | $152,379 | |
| Previous Owner | Arteaga Jose Luis | $120,300 |
Source: Public Records
Tax History Compared to Growth
Tax History
| Year | Tax Paid | Tax Assessment Tax Assessment Total Assessment is a certain percentage of the fair market value that is determined by local assessors to be the total taxable value of land and additions on the property. | Land | Improvement |
|---|---|---|---|---|
| 2025 | $2,782 | $260,519 | $91,180 | $169,339 |
| 2024 | $2,782 | $255,411 | $89,392 | $166,019 |
| 2023 | $2,704 | $250,403 | $87,639 | $162,764 |
| 2022 | $2,668 | $245,494 | $85,921 | $159,573 |
| 2021 | $2,650 | $240,680 | $84,236 | $156,444 |
| 2020 | $2,604 | $238,212 | $83,372 | $154,840 |
| 2019 | $2,580 | $233,541 | $81,737 | $151,804 |
| 2018 | $2,544 | $228,961 | $80,134 | $148,827 |
| 2017 | $2,453 | $224,472 | $78,563 | $145,909 |
| 2016 | $2,357 | $220,071 | $77,023 | $143,048 |
| 2015 | $2,341 | $216,765 | $75,866 | $140,899 |
| 2014 | $2,269 | $212,519 | $74,380 | $138,139 |
Source: Public Records
Map
Nearby Homes
- 2408 S Taylor Place
- 513 E Fairfield Ct
- 2300 S Sultana Ave Unit 298
- 2119 S Phoenix Place
- 4235 S Gasly Paseo
- 0 Vineyard Unit CV25067044
- 4245 S Grasly Paseo
- 4233 S Grasly Paseo
- 0 Phillips Unit CV23180894
- 2437 S Garfield Place
- 2148 S Sultana Ave
- 310 E Philadelphia St Unit 35
- 310 E Philadelphia St
- 2001 S Campus Ave Unit 7F
- 2030 S Bon View Ave Unit G
- 1020 E Tam o Shanter Ct
- 840 E Cedar St
- 2453 S Marigold Place
- 2343 S Via Veranda Unit 10
- 2333 S Via Esplanade Unit 29
- 2415 S Phoenix Place
- 2403 S Phoenix Place
- 2402 Caldwell Place
- 2410 Caldwell Place
- 2421 S Phoenix Place
- 2402 S Phoenix Place
- 2420 Caldwell Place
- 2427 S Phoenix Place
- 2410 S Phoenix Place
- 2403 Caldwell Place
- 2420 S Phoenix Place
- 2426 Caldwell Place
- 2433 S Phoenix Place
- 2426 S Phoenix Place
- 2432 Caldwell Place
- 2409 Caldwell Place
- 2415 Caldwell Place
- 2432 S Phoenix Place
- 2439 S Phoenix Place
- 2421 Caldwell Place