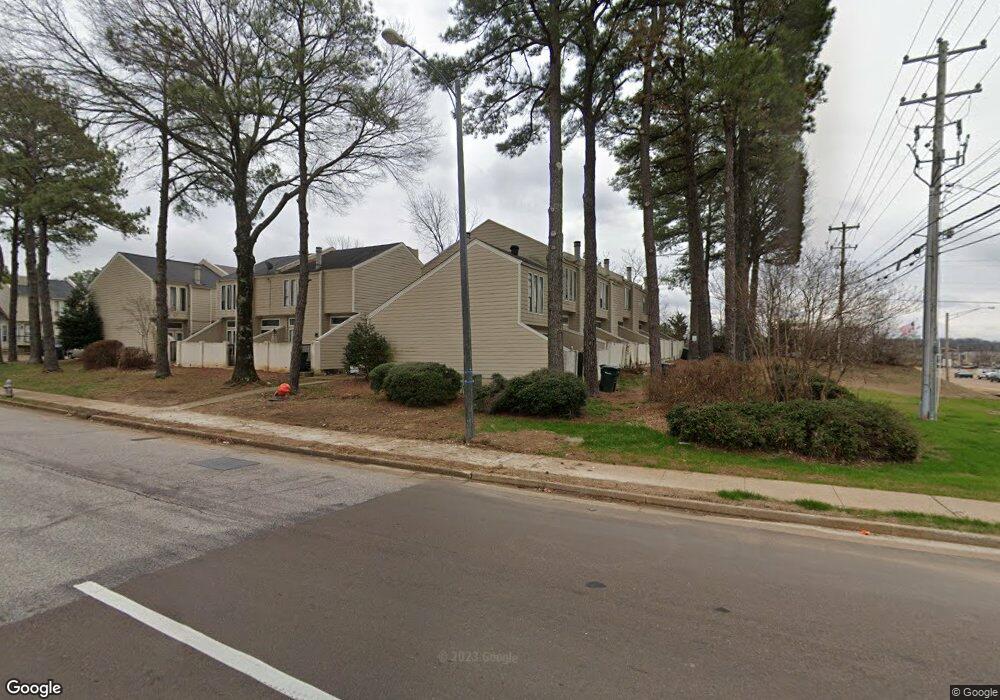
2409 W End Row Unit A3 Cordova, TN 38016
Cordova NeighborhoodEstimated Value: $100,000 - $131,264
2
Beds
3
Baths
1,276
Sq Ft
$88/Sq Ft
Est. Value
About This Home
This home is located at 2409 W End Row Unit A3, Cordova, TN 38016 and is currently estimated at $112,316, approximately $88 per square foot. 2409 W End Row Unit A3 is a home located in Shelby County with nearby schools including Chimneyrock Elementary School, Kate Bond Middle School, and Cordova High School.
Ownership History
Date
Name
Owned For
Owner Type
Purchase Details
Closed on
Dec 24, 2003
Sold by
Pollina Anthony L and Pollina Jennifer L
Bought by
Mason Joseph
Current Estimated Value
Home Financials for this Owner
Home Financials are based on the most recent Mortgage that was taken out on this home.
Original Mortgage
$64,050
Outstanding Balance
$29,555
Interest Rate
5.82%
Mortgage Type
Purchase Money Mortgage
Estimated Equity
$82,761
Purchase Details
Closed on
Jun 22, 2001
Sold by
Gill Frank R and Gill Debra G
Bought by
Pollina Anthony L
Home Financials for this Owner
Home Financials are based on the most recent Mortgage that was taken out on this home.
Original Mortgage
$51,600
Interest Rate
7.18%
Purchase Details
Closed on
Jul 3, 1996
Sold by
Watts Rex Eric and Watts Laura E
Bought by
Gill Frank R and Grady Debra G
Home Financials for this Owner
Home Financials are based on the most recent Mortgage that was taken out on this home.
Original Mortgage
$43,600
Interest Rate
7.99%
Create a Home Valuation Report for This Property
The Home Valuation Report is an in-depth analysis detailing your home's value as well as a comparison with similar homes in the area
Home Values in the Area
Average Home Value in this Area
Purchase History
| Date | Buyer | Sale Price | Title Company |
|---|---|---|---|
| Mason Joseph | $60,000 | -- | |
| Pollina Anthony L | $64,500 | -- | |
| Gill Frank R | $54,500 | Security Title Company Inc |
Source: Public Records
Mortgage History
| Date | Status | Borrower | Loan Amount |
|---|---|---|---|
| Open | Mason Joseph | $64,050 | |
| Previous Owner | Pollina Anthony L | $51,600 | |
| Previous Owner | Gill Frank R | $43,600 |
Source: Public Records
Tax History Compared to Growth
Tax History
| Year | Tax Paid | Tax Assessment Tax Assessment Total Assessment is a certain percentage of the fair market value that is determined by local assessors to be the total taxable value of land and additions on the property. | Land | Improvement |
|---|---|---|---|---|
| 2025 | $558 | $28,425 | $1,550 | $26,875 |
| 2024 | $558 | $16,450 | $1,550 | $14,900 |
| 2023 | $1,002 | $16,450 | $1,550 | $14,900 |
| 2022 | $1,002 | $16,450 | $1,550 | $14,900 |
| 2021 | $1,014 | $16,450 | $1,550 | $14,900 |
| 2020 | $685 | $9,450 | $1,550 | $7,900 |
| 2019 | $685 | $9,450 | $1,550 | $7,900 |
| 2018 | $685 | $9,450 | $1,550 | $7,900 |
| 2017 | $388 | $9,450 | $1,550 | $7,900 |
| 2016 | $459 | $10,500 | $0 | $0 |
| 2014 | $459 | $10,500 | $0 | $0 |
Source: Public Records
Map
Nearby Homes
- 8267 Chippingham Dr
- 2329 Foxmoor Ln Unit 7
- 8425 Brownstone Ln Unit 50
- 8437 Rembrook Dr
- 2033 Westbriar Dr
- 2265 Easton Dr
- 7828 Deerfield Trace
- 7723 Reese Rd
- 2718 Kate Bond Rd
- 2000 Westbriar Dr
- 2029 Woodchase Cove
- 2065 Steeplebrook Dr
- 4011 Woodchase Cove
- 2461 Eagleridge Ln
- 2412 Kate Bond Rd
- 7374 U S Highway 64
- 7685 Crystal Brook Cove
- 2497 Eagleridge Ln
- 8607 Geiberger Dr
- 8599 Geiberger Dr
- 2407 W End Row Unit A2
- 2405 W End Row
- 2411 W End Row Unit A4
- 2414 W End Row Unit B7
- 2415 W End Row Unit A5
- 2412 W End Row Unit B6
- 2407 Talmadge Place Unit C8
- 2409 Talmadge Place Unit C9
- 2411 Talmadge Place Unit C10
- 2415 Talmadge Place Unit C11
- 2408 Talmadge Place Unit D12
- 2410 Talmadge Place Unit D13
- 2412 Talmadge Place Unit D14
- 2410 Talmadge Pl Place Unit D-13
- 2414 Talmadge Place
- 2416 Talmadge Place Unit D16
- 8156 Harley Square Unit E-17
- 8156 Harley St Unit E17
- 8158 Harley St Unit E18
- 8160 Harley St